

30.6.2024
Barometro dei rischi nazionali e settoriali
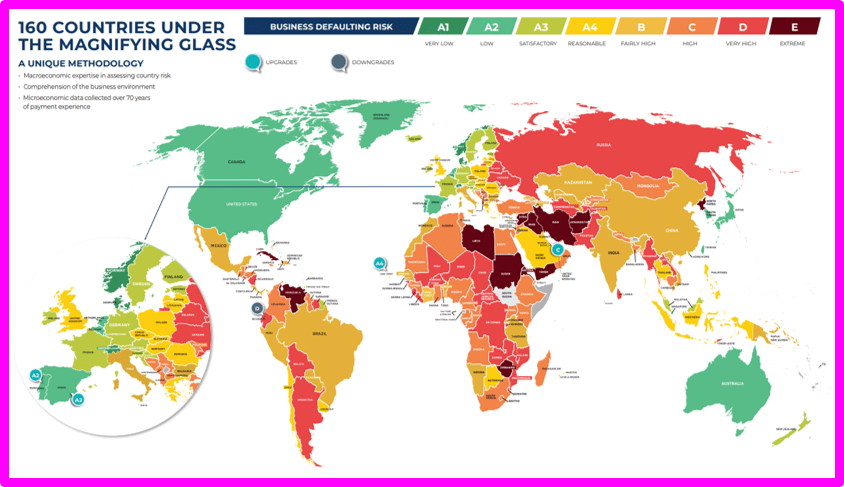
Secondo il team di Ricerca Economica di Coface, i Paesi emergenti, in particolare quelli asiatici, sono oggi la forza trainante di un’economia mondiale ancora in convalescenza, proprio come l’Europa, che sembra, finalmente, risvegliarsi dal suo letargo. Gli ultimi dati concreti e le indagini sulle imprese pubblicati nelle ultime settimane suggeriscono che questa dinamica è ancora in atto nel momento in cui scriviamo e si riflette in una notevole ripresa del commercio internazionale.
https://www.coface.com/news-economy-and-insights
30.6.2024
Barometer Country And Sector Risks Barometer
Coface Economic Research team report the emerging countries, particularly in Asia, are now the driving force behind a world economy that is still convalescing, much like Europe, which seems, at last, to be awakening from its lethargy. The latest hard data and business surveys published in recent weeks suggest that this dynamic is still at work at the time of writing and is reflected in a noticeable rebound in international trade.
https://www.coface.com/news-economy-and-insights
Europa Soils
29.5.2024
Terreni in cattive condizioni
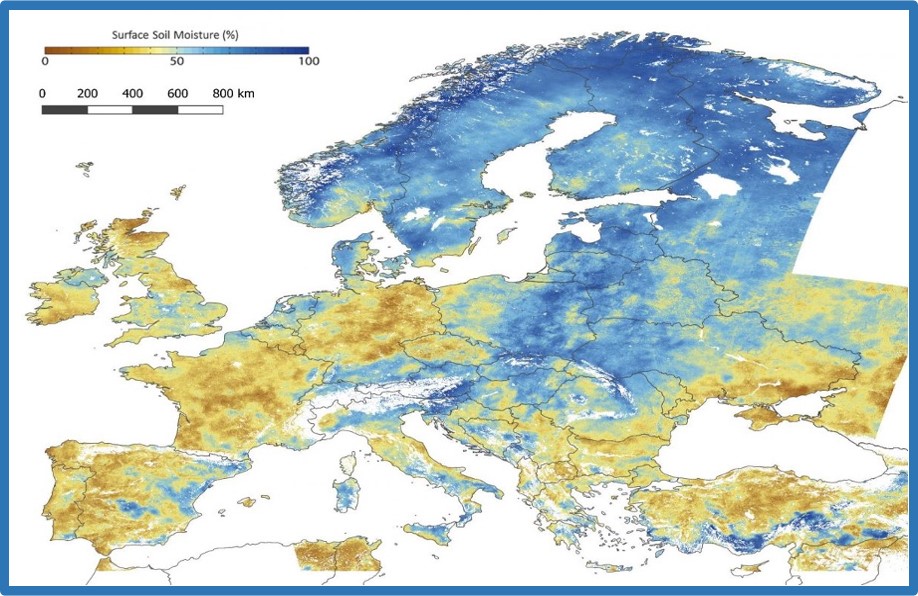
Il degrado del suolo è un problema complesso causato da pratiche di gestione del suolo insostenibili, dall’inquinamento e dall’espansione agricola. Solo in Europa, oltre il 60% dei suoli sono attualmente classificati come insalubri. Quando si considera come le tecnologie spaziali, in particolare il Programma spaziale dell’UE, possono contribuire a ripristinare questi suoli, uno strumento ovvio che viene in mente è il Copernicus Land Monitoring Service (CLMS). CLMS fornisce, tra gli altri, prodotti sull'umidità del suolo che trovano applicazione in agricoltura, gestione delle acque, modellizzazione ecologica e conservazione della natura. Mappa che mostra l'umidità superficiale del suolo in Europa, che mostra uno dei tanti prodotti CLMS che rilevano i suoli in tutta Europa. Fonte: CLMS.
https://www.copernicus.eu/en/news/news/observer-caring-our-soils-eu-space-programme
29.5.2024
Soils in bad shape
Soil degradation is a complex issue driven by unsustainable soil management practices, pollution, and agricultural expansion. In Europe alone, over 60% of soils are currently classified as unhealthy. When considering how space technologies, in particular the EU Space Programme, can help to restore these soils, one obvious tool that comes to mind is the Copernicus Land Monitoring Service (CLMS). CLMS provides products on soil moisture, among others, which have applications in agriculture, water management, ecological modelling and nature conservation.
Map showing surface soil moisture in Europe, showcasing one of the many CLMS products surveying soils across Europe. Credit: CLMS.
https://www.copernicus.eu/en/news/news/observer-caring-our-soils-eu-space-programme
ESG & Carbon Risk Scores
6.4.2024
ESG & Carbon Risk Scores
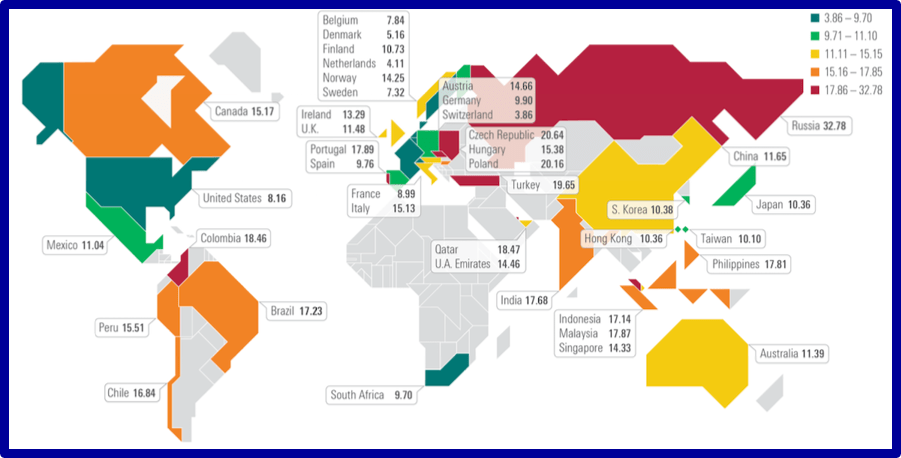
Environmental, Social, Governance: tre dimensioni fondamentali per verificare, misurare, controllare e sostenere (con acquisto di prodotti o con scelte di investimento) l’impegno in termini di sostenibilità di una impresa o di una organizzazione.
Le regole che stanno stimolando e supportando le imprese nell’affrontare la trasformazione sostenibile passano attraverso i ruoli e i parametri della finanza etica e sostenibile.
I mercati dell'Europa occidentale come la Svizzera, i Paesi Bassi, la Danimarca, la Svezia, il Belgio e la Francia, con forti pratiche ESG, portano i livelli più bassi di rischio di carbonio, così come il Sudafrica e gli Stati Uniti. https://www.morningstar.com/views/blog/esg/mapping-material-risk-worldwide
6.4.2024
ESG & Carbon Risk Scores
Environmental, Social, Governance: three fundamental dimensions for verifying, measuring, controlling and supporting (with the purchase of products or investment choices) the commitment in terms of sustainability of a company or organisation.
The rules that are stimulating and supporting companies in tackling sustainable transformation they pass through the roles and parameters of ethical and sustainable finance.
Western European markets such as Switzerland, the Netherlands, Denmark, Sweden, Belgium and France, with strong ESG practices, carry the lowest levels of carbon risk, as do South Africa and the United States.
https://www.morningstar.com/views/blog/esg/mapping-material-risk-worldwide
Countries according to the Fragile States Index
25 Marzo 2024
Paesi secondo l’Indice degli Stati Fragili 2023
Aut: Clyde H.
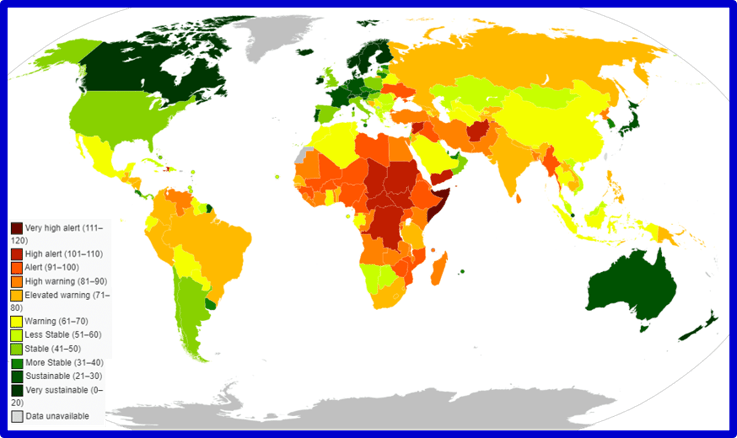
Mappa dei paesi colorata in base al loro punteggio nel Rapporto annuale 2023 sull'indice degli Stati fragili.
https://en.wikipedia.org/wiki/Failed_state
Mars 25,2024
Countries according to the 2023 Fragile States Index
Aut: Clyde H.
Map of countries colored by their score in the Fragile States Index Annual Report 2023
https://en.wikipedia.org/wiki/Failed_state
2024 Forecasts
Previsioni per il 2024
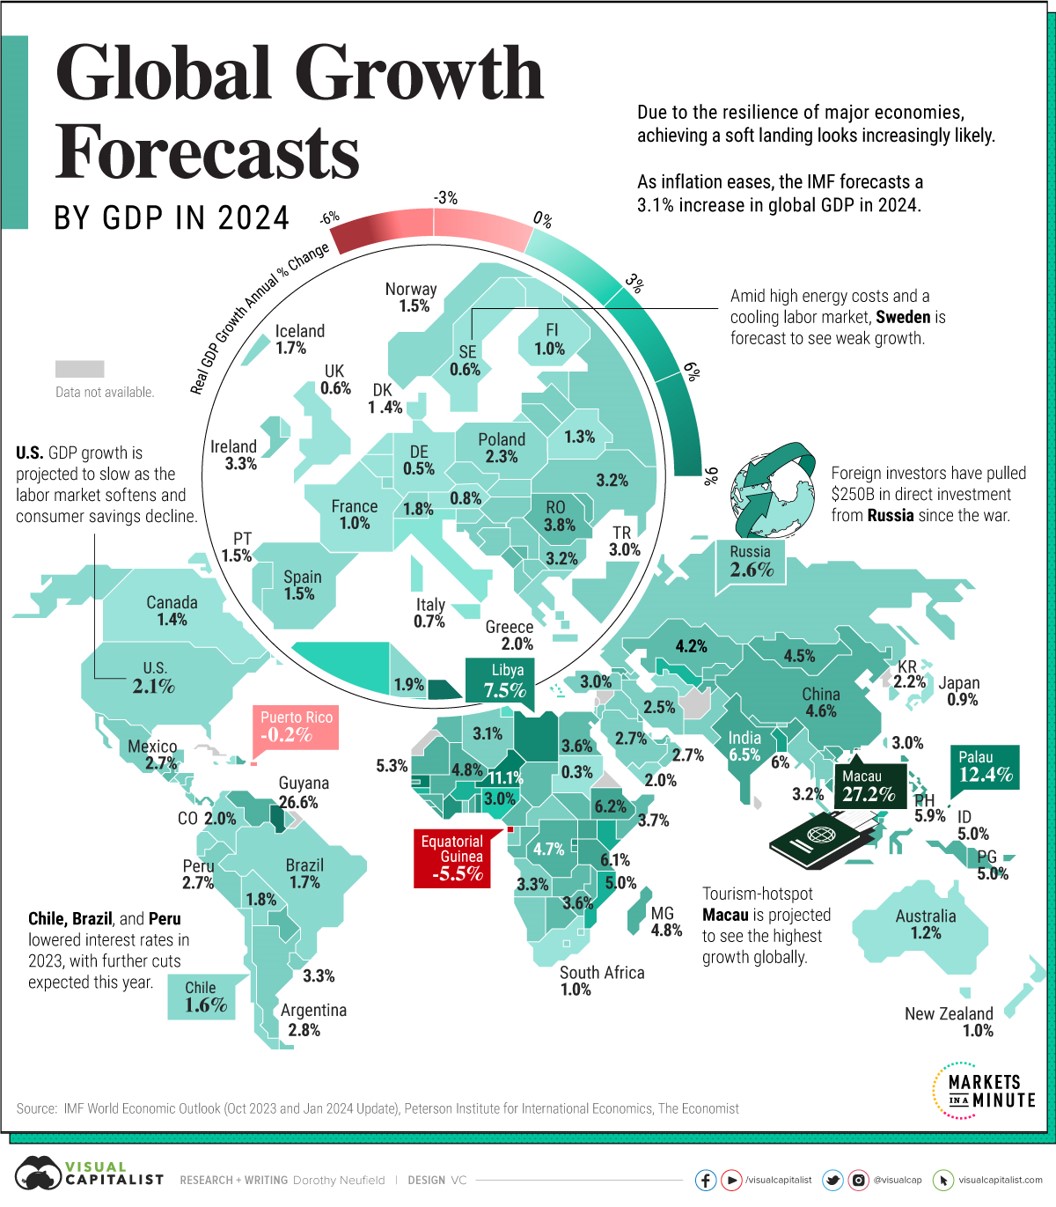
La crescita resiliente del PIL e il calo dell’inflazione stanno stimolando prospettive più positive per il 2024, anche se permangono cautela nelle economie globali. Mentre gli investitori sperano che i tagli dei tassi statunitensi possano avvenire già a maggio, la Fed ha segnalato che non “dichiarerà la vittoria” troppo presto. Mentre i paesi di tutto il mondo si muovono in un panorama complesso, si trovano ad affrontare una serie di rischi che includono picchi inflazionistici, crescenti carichi di debito e diminuzione dei risparmi dei consumatori. Questo grafico mostra le proiezioni di crescita del PIL globale nel 2024, sulla base delle previsioni di ottobre 2023 del Fondo monetario internazionale (FMI) e dell’aggiornamento di gennaio 2024. Nel 2024, si prevede che la crescita del PIL reale aumenterà del 3,1%, in leggero aumento rispetto alle previsioni di ottobre. Sebbene sia prevista una crescita positiva in tutte le regioni, essa varia ampiamente a causa di molti fattori che vanno dagli effetti dei costi di finanziamento più elevati alla scarsa fiducia dei consumatori.
https://www.visualcapitalist.com/gdp-growth-forecasts-by-country-in-2024/
11.2.2024
Forecasts in 2024
Resilient GDP growth and falling inflation are spurring a brighter outlook for 2024, although cautions remain across global economies. While investors are hopeful that U.S. rate cuts could happen as early as May, the Fed has signaled that it won’t “declare victory” too soon. As countries around the world maneuver a complex landscape, they are faced with a scope of risks that include inflationary spikes, rising debt loads, and dwindling consumer savings. This graphic shows global GDP growth projections in 2024, based on the International Monetary Fund (IMF) October 2023 Outlook and January 2024 update. In 2024, real GDP growth is forecast to increase 3.1%, a slight rise from October’s outlook. While positive growth is projected across all regions, it varies widely due to many factors spanning from the effects of higher borrowing costs to low consumer sentiment.
https://www.visualcapitalist.com/gdp-growth-forecasts-by-country-in-2024/
Interconnection risks landscape
10.1.2024
La rete dei rischi
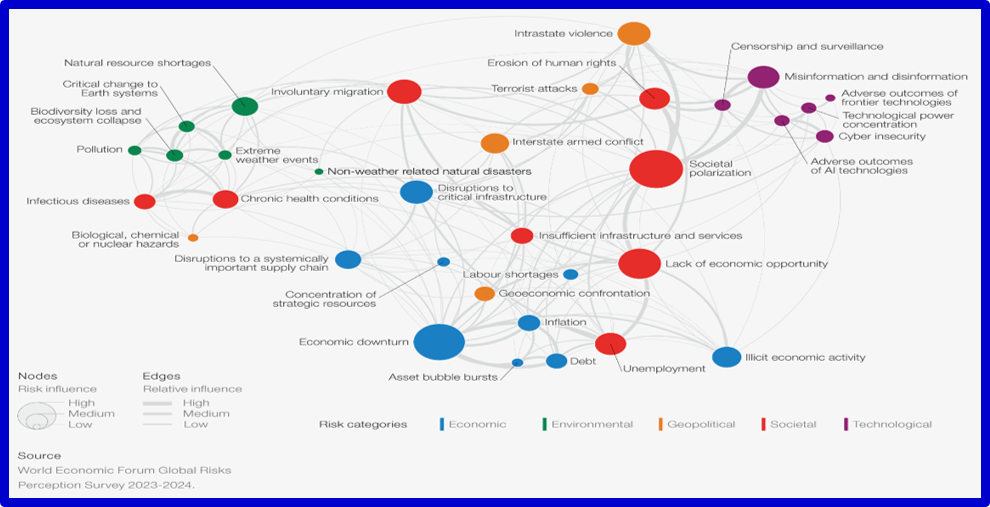
L’immagine è tratta dal Sommario del Rapporto del World Economic Forum sui rischi globali ed illustra l’interconnessione delle situazioni critiche emergenti. La polarizzazione sociale e la recessione economica sono considerati i rischi più interconnessi e quindi influenti nella rete globale, come fattori trainanti e possibili conseguenze di numerosi rischi.
https://www.weforum.org/publications/global-risks-report-2024/
10.1.2024
Interconnection map of global risks landscape.
The image is taken from the Summary of the World Economic Forum Report on Global Risks and illustrates the interconnection of emerging critical situations. Social polarization and economic recession are considered the most interconnected and therefore influential risks in the global network, as drivers and possible consequences of numerous risks.
https://www.weforum.org/publications/global-risks-report-2024/
The web giants
14 dicembre 2023
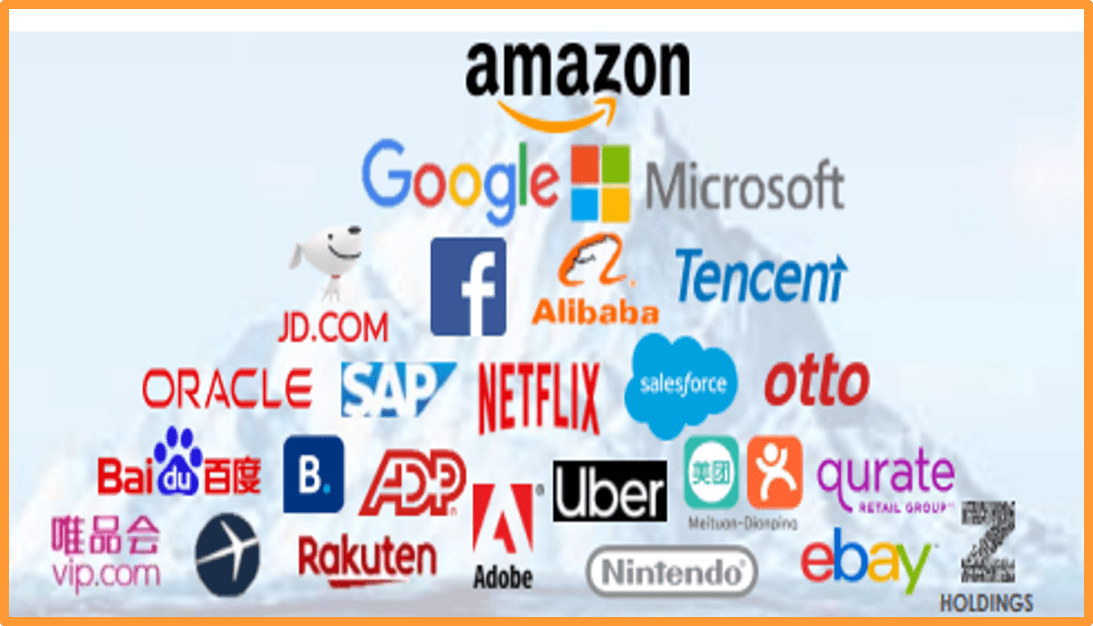
I giganti del web nei primi nove mesi del 2023.
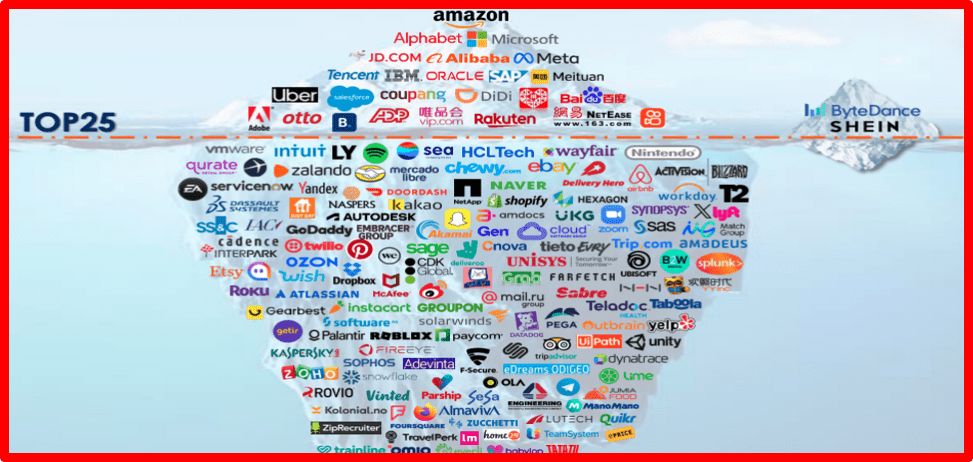
Il fatturato aggregato dei maggiori operatori mondiali del WebSoft cresce del 10,6% rispetto allo stesso periodo del 2022. È quanto segnala l’indagine annuale dell’Area Studi Mediobanca sulle 25 maggiori WebSoft internazionali (Software & Web Companies con ricavi superiori a 12 miliardi di euro ciascuna) nel triennio 2019-2022 e nei primi nove mesi del 2023. Amazon, Alphabet e Microsoft rappresentano oltre la metà dei ricavi aggregati tra le società web.
https://www.areastudimediobanca.com/it/product/report-websoft-ed-2023
December 14, 2023
The giants of the web in the first nine months of 2023.
The aggregate turnover of the world's largest WebSoft operators grows by 10.6% compared to the same period of 2022. This is what the annual survey of the Mediobanca Research Area on the 25 largest international WebSofts reports (Software & Web Companies with revenues exceeding 12 billion euros each) in the three-year period 2019-2022 and in the first nine months of 2023. Amazon, Alphabet and Microsoft represent more than half of the aggregate revenues among web companies.
https://www.areastudimediobanca.com/it/product/report-websoft-ed-2023
Martian Lake

12 dicembre 2023
Il rover Perseverance della NASA decifra l'antica storia del lago marziano
Il cratere Jezero, il sito di atterraggio di Marte 2020: questa immagine del cratere Jezero di Marte è sovrapposta con i dati minerali rilevati dall’orbita. Il colore verde rappresenta i carbonati – minerali che si formano in ambienti acquosi con condizioni che potrebbero essere favorevoli per preservare i segni della vita antica. Il rover Perseverance della NASA sta attualmente esplorando l’area verde sopra il cratere di Jezero (al centro). Fonte: NASA/JPL-Caltech/MSSS/JHU-APL
“Abbiamo scelto il cratere Jezero come sito di atterraggio perché le immagini orbitali hanno mostrato un delta – una chiara prova che un grande lago una volta riempiva il cratere. Un lago è un ambiente potenzialmente abitabile e le rocce delta sono un ottimo ambiente per seppellire segni di vita antica come fossili nella documentazione geologica “, ha detto Ken Farley di Caltech, scienziato del progetto Perseverance. “Dopo un’esplorazione approfondita, abbiamo messo insieme la storia geologica del cratere, tracciando il suo lago e la fase fluviale dall’inizio alla fine”.
Jezero si è formata da un impatto di asteroidi quasi 4 miliardi di anni fa. Dall’atterraggio nel febbraio 2021, il team di Perseverance ha scoperto che il fondo del cratere è fatto di roccia ignea formata da magma sotterranea o da attività vulcanica in superficie. Da allora hanno trovato arenaria e fango, segnalando l’arrivo del primo fiume nel cratere centinaia di milioni di anni dopo. Sopra queste rocce ci sono pietre di fango ricche di sale, che segnalano la presenza di un lago poco profondo che sta vivendo l'evaporazione.
December 12, 2023
NASA's Perseverance Rover Deciphers Ancient History of Martian Lake
Jezero Crater, Mars 2020's Landing Site: this image of Mars’ Jezero Crater is overlaid with mineral data detected from orbit. The green color represents carbonates – minerals that form in watery environments with conditions that might be favorable for preserving signs of ancient life. NASA’s Perseverance is currently exploring the green area above Jezero’s fan (center). Credits: NASA/JPL-Caltech/MSSS/JHU-APL
“We picked Jezero Crater as a landing site because orbital imagery showed a delta – clear evidence that a large lake once filled the crater. A lake is a potentially habitable environment, and delta rocks are a great environment for entombing signs of ancient life as fossils in the geologic record,” said Perseverance’s project scientist, Ken Farley of Caltech. “After thorough exploration, we’ve pieced together the crater’s geologic history, charting its lake and river phase from beginning to end.”
Jezero formed from an asteroid impact almost 4 billion years ago. Since landing in February, 2021, the Perseverance team has discovered the crater floor is made of igneous rock formed from magma underground or from volcanic activity at the surface. They have since found sandstone and mudstone, signaling the arrival of the first river in the crater hundreds of millions of years later. Above these rocks are salt-rich mudstones, signaling the presence of a shallow lake experiencing evaporation.
World Robotics
Ottobre 2023
Il mercato dei robot
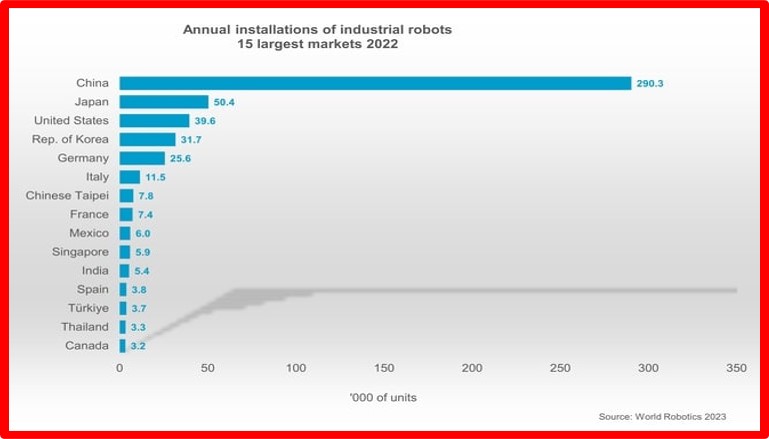
La Cina è di gran lunga il mercato più grande del mondo. Nel 2022, le installazioni annuali di 290.258 unità hanno sostituito il precedente record del 2021 con una crescita del 5%. Quest’ultimo incremento è notevole poiché supera addirittura il risultato del 2021, ovvero un aumento del 57% rispetto al 2020. Per servire questo mercato dinamico, i fornitori di robot nazionali e internazionali hanno stabilito impianti di produzione in Cina e aumentato continuamente la capacità. In media, le installazioni annuali di robot sono cresciute del 13% ogni anno (2017-2022).
Le installazioni di robot in Giappone sono aumentate del 9% raggiungendo 50.413 unità, superando il livello pre-pandemia di 49.908 unità nel 2019. Il livello di picco rimane a 55.240 unità nel 2018. Il Paese è al secondo posto dopo la Cina per dimensioni del mercato dei robot industriali. Le installazioni annuali hanno guadagnato il 2% in media all’anno (2017-2022).
https://ifr.org/ifr-press-releases/news/world-robotics-2023-report-asia-ahead-of-europe-and-the-americas
October 2023
Robot Market
China is by far the world´s largest market. In 2022, annual installations of 290,258 units replaced the previous record of 2021 by growth of 5%. This latest gain is remarkable since it even tops the 2021 result that was a 57% jump compared to 2020. To serve this dynamic market, domestic and international robot suppliers have established production plants in China and continuously increased capacity. On average, annual robot installations have grown by 13% each year (2017-2022).
Robot installations in Japan were up by 9% to 50,413 units, exceeding the pre-pandemic level of 49,908 units in 2019. The peak level remains at 55,240 units in 2018. The country ranks second to China in size of market for industrial robots. Annual installations gained 2% on average per year (2017-2022).
https://ifr.org/ifr-press-releases/news/world-robotics-2023-report-asia-ahead-of-europe-and-the-americas
Hot Mediterranean
12 ottobre 2023
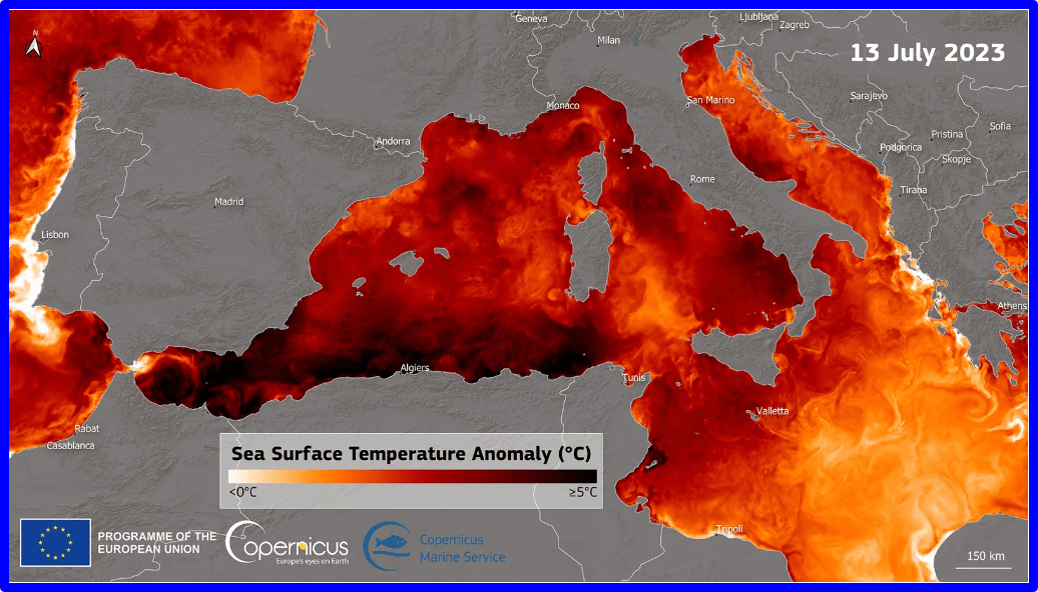
Mediterraneo caldo
Visualizzazione basata sui dati di CMEMS, che mostrano l'anomalia della temperatura della superficie del mare registrata il 13 luglio 2023. I dati mostrano temperature elevate lungo le coste di Spagna, Marocco e Algeria. Credito: Unione Europea, CMEMS. Mentre il nostro mondo affronta le sfide poste da questi eventi estremi, Copernicus rimane fermo nel suo impegno nel fornire dati, approfondimenti e strumenti preziosi per aiutarci a misurare, valutare e rispondere a questi cambiamenti climatici. In un’era in cui il cambiamento climatico rappresenta una minaccia significativa per gli ecosistemi del nostro pianeta e per il benessere delle generazioni future, Copernicus continua a essere un alleato essenziale nella nostra ricerca per salvaguardare il futuro del nostro pianeta.
https://www.copernicus.eu/en/news/news/observer-summer-extremes-captured-copernicus
October 12, 2023
Hot Mediterranean
Visualisation based on data from CMEMS, showing the Sea Surface Temperature anomaly recorded on 13 July 2023. The data shows elevated temperatures along the coasts of Spain, Morocco and Algeria. Credit: European Union, CMEMS.
As our world faces the challenges posed by these extreme events, Copernicus remains steadfast in its commitment to providing valuable data, insights, and tools to help us measure, assess, and respond to these climatic changes. In an era in which climate change poses a significant threat to our planet’s ecosystems and the well-being of future generations, Copernicus continues to be an essential ally in our quest to safeguard our planet's future.
https://www.copernicus.eu/en/news/news/observer-summer-extremes-captured-copernicus
G7 versus BRICS
24 agosto 2023
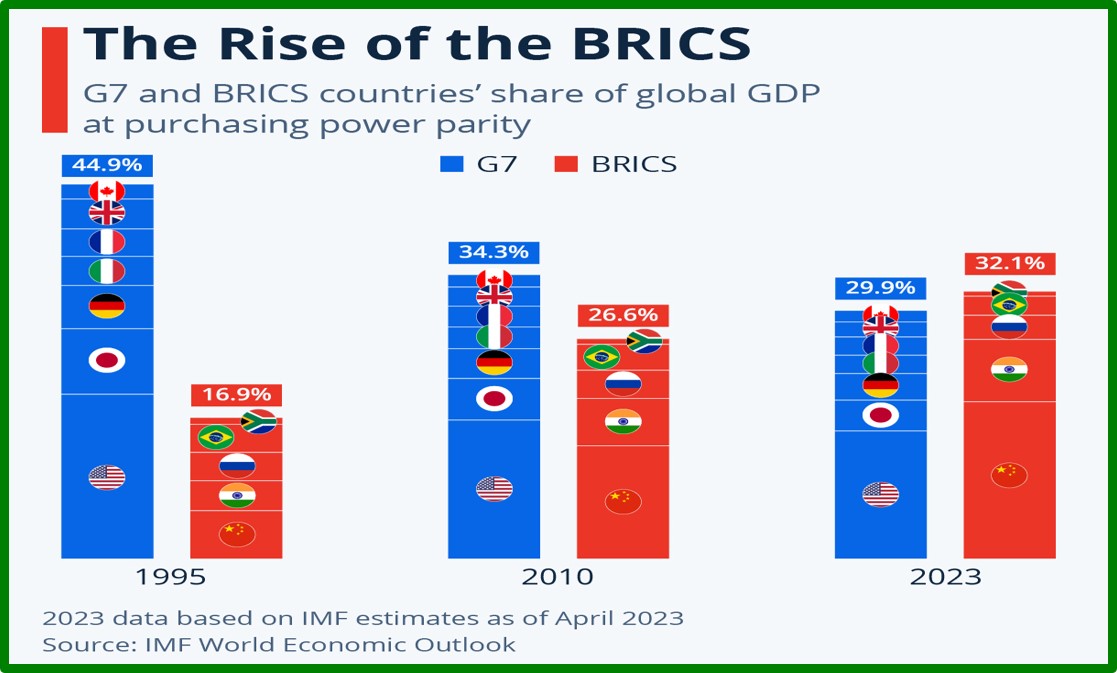
L’ascesa dei BRICS.
Le nazioni del G7 sono Stati Uniti d'America, Regno Unito, Canada, Francia, Giappone, Germania e Italia. Si prevede che Brasile, Russia, India, Cina e Sud Africa, noti collettivamente come le nazioni BRICS, rivali economici globali per il continuo dominio del commercio globale da parte delle nazioni del G7, rappresenteranno il 32,1% del prodotto interno lordo (PIL) globale. nel 2023, afferma il Fondo monetario internazionale (FMI).
«I BRICS sono un gruppo eterogeneo di nazioni, dichiara il Presidente Sudafricano Cyril Ramaphosa, si tratta di un partenariato paritario tra Paesi che hanno punti di vista diversi ma hanno una visione condivisa per un mondo migliore. La visione dei BRICS è quella di essere come paladini dei bisogni e delle preoccupazioni dei popoli del Sud del mondo. Questi includono la necessità di una crescita economica benefica, di uno sviluppo sostenibile e di una riforma dei sistemi multilaterali. Abbiamo deciso di invitare la Repubblica Argentina, la Repubblica Araba d'Egitto, la Repubblica Federale Democratica dell'Etiopia, la Repubblica Islamica dell'Iran, il Regno dell'Arabia Saudita e gli Emirati Arabi Uniti a diventare membri a pieno titolo dei BRICS. L’adesione avrà effetto dal 1° gennaio 2024.» https://brics2023.gov.za/2023/08/24/brics-chair-president-cyril-ramaphosas-media-briefing-remarks-announcing-the-outcomes-of-the-xv-brics-summit/
Restano in attesa di far parte dei BRICS almeno 22 altri Paesi, tra cui Indonesia e Nigeria, Tailandia, Senegal, Marocco, Algeria, Cuba, Venezuela, Bolivia, Vietnam, Bangladesh, Bielorussia, Honduras e Kazakhstan.
Si prepara un nuovo ordine mondiale multipolare?https://www.statista.com/chart/30638/brics-and-g7-share-of-global-gdp/
August 24, 2023
The rise of the BRICS nations.
The G7 nations are the United States of America, the United Kingdom, Canada, France, Japan, Germany, and Italy. Brazil, Russia, India, China, and South Africa, collectively known as the BRICS nations, a global economic rival to the continued dominance of global trade by the G7 nations, are expected to account for 32.1 percent of global Gross Domestic Product (GDP) in 2023, says the International Monetary Fund (IMF).
«The BRICS are a diverse group of nations, says South African President Cyril Ramaphosa, it is an equal partnership between countries that have different points of view but have a shared vision for a better world.The vision of the BRICS is to be like champions of the needs and concerns of the peoples of the Global South. These include the need for beneficial economic growth, sustainable development and reform of multilateral systems. We have decided to invite the Argentine Republic, the Arab Republic of Egypt, the Federal Democratic Republic of Ethiopia, the Islamic Republic of Iran, the Kingdom of Saudi Arabia and the United Arab Emirates to become full members of the BRICS. Membership will take effect from 1 January 2024. https://brics2023.gov.za/2023/08/24/brics-chair-president-cyril-ramaphosas-media-briefing-remarks-announcing-the-outcomes-of-the-xv-brics-summit/.
At least 22 other countries are waiting to join the BRICS, including Indonesia and Nigeria, Thailand, Senegal, Morocco, Algeria, Cuba, Venezuela, Bolivia, Vietnam, Bangladesh, Belarus, Honduras and Kazakhstan.Is a new multipolar world order being prepared? https://www.statista.com/chart/30638/brics-and-g7-share-of-global-gdp/
Happiness in the World
2 Agosto 2023
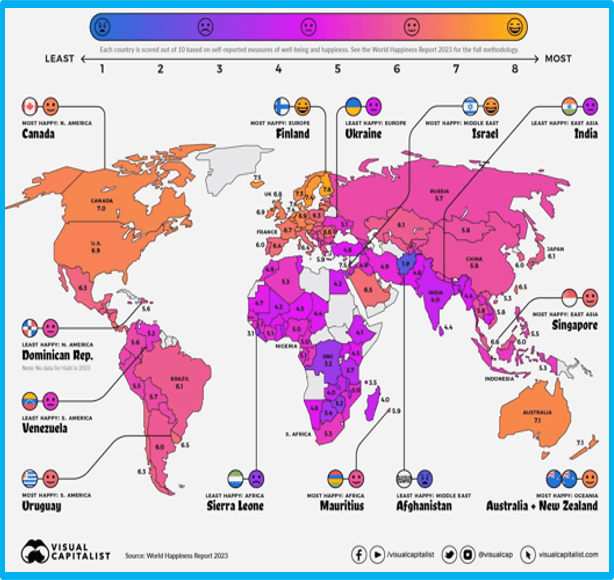
Felicità nel mondo?
Il Sustainable Development Solutions Network lo scorso 20 marzo ha pubblicato un Report sulla felicità nel mondo che considera parametri come il sostegno sociale, il reddito, la salute, la libertà, la generosità e l’assenza di corruzione (vedi il Report completo http://worldhappiness.report/, recensito nel nostro sito con la data del 20 marzo 2023). Recentemente il quotidiano IlSole24Ore ha ripubblicato un proprio articolo con alcune considerazioni critiche sul Report: https://www.infodata.ilsole24ore.com/2023/07/30/la-finlandia-e-di-nuovo-in-cima-alla-classifica-dei-paesi-piu-felici-del-mondo/ e ha incluso una mappa Mapped: The World's Happiest Countries in 2023 (visualcapitalist.com) che indica i Paesi secondo un indice di felicità.
August 2, 2023
Happiness in the world?
The Sustainable Development Solutions Network last March 20 published a Report on Happiness in the World which considers parameters such as social support, income, health, freedom, generosity and the absence of corruption (see the complete Report http://worldhappiness.report/, reviewed on our site with the date of March 20, 2023). Recently the IlSole24Ore, italian newspaper, republished its own article with some critical considerations on the Report: https://www.infodata.ilsole24ore.com/2023/07/30/la-finlandia-e-di-nuovo-in-cima-alla- ranked-the-happiest-countries-in-the-world/ and included a map Mapped: The World's Happiest Countries in 2023 (visualcapitalist.com) which ranks countries according to a happiness index.
Be prepared to green
21 aprile 2023
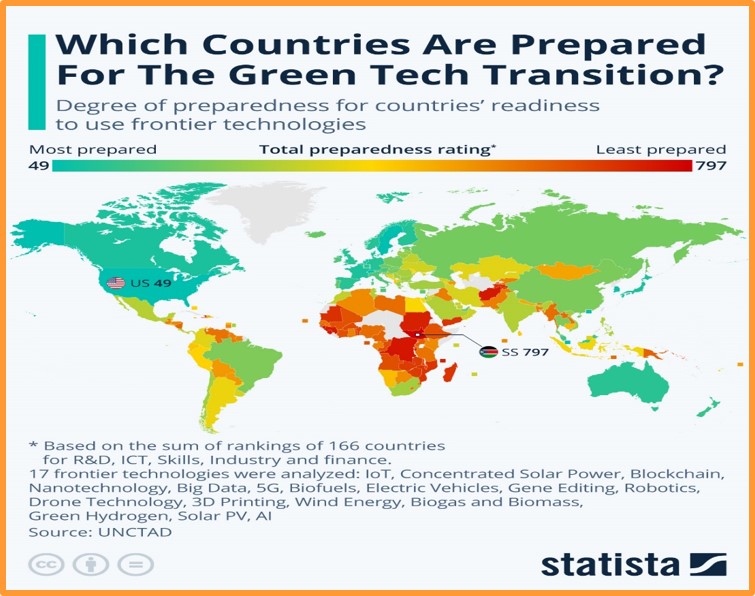
Quali paesi sono meglio preparati per la transizione alla tecnologia verde?
Stati Uniti, Svezia, Singapore, Svizzera e Paesi Bassi sono i cinque paesi più preparati a utilizzare, adottare o adattarsi alle tecnologie di frontiera, che saranno essenziali per la transizione alla tecnologia verde, secondo i dati rilasciati dalla Conferenza delle Nazioni Unite sul commercio e Sviluppo (UNCTAD). 166 paesi sono stati classificati in base al loro livello di preparazione per iniziare a utilizzare tecnologie di frontiera con i seguenti cinque indicatori: TIC, competenze, industria, ricerca e sviluppo e finanza. Nonostante la capacità della Cina di produrre e innovare tecnologie di frontiera, il paese si è classificato al di sotto di quanto ci si sarebbe potuto aspettare, arrivando al 35° posto, a causa delle disparità urbane-rurali nella copertura di Internet e nella velocità della banda larga.
https://www.statista.com/chart/29789/map-of-countries-preparation-for-frontier-technologies/
April 21, 2023
Which Countries Are Best Prepared For The Green Tech Transition?
The United States, Sweden, Singapore, Switzerland and the Netherlands are the five most prepared countries to use, adopt or adapt to frontier technologies, which will be essential to the green tech transition, according to data released by the United Nations Conference on Trade and Development (UNCTAD). 166 countries were ranked on their level of preparedness to start using frontier technologies with the five following indicators: ICT, Skills, Industry, Research and Development and Finance. The following map uses the summed rank of each indicator to give a final score. Despite China’s ability to produce and innovate frontier technologies, the country ranked lower than might have been expected, coming in 35th place, due to its urban-rural disparities in internet coverage and broadband speed. https://www.statista.com/chart/29789/map-of-countries-preparation-for-frontier-technologies/
Megaprojects

4 aprile 2023
I megaprogetti mondiali
In questo momento, ci sono diversi progetti in corso che superano la dimensione di $ 100 miliardi, nonostante il fatto che proposte di costruzione da $ 10 miliardi fossero considerate megaprogetti solo alcuni anni fa. Dei nove megaprogetti in corso identificati da 1Build, International Construction Magazine e Construction Review per un costo pari o superiore a 100 miliardi di dollari, quattro erano in costruzione negli Stati del Golfo Arabo. Ciò include l'ambizioso progetto di Neom City, in realtà un insieme di paesi e città futuristici che vengono costruiti nell'Arabia Saudita nordoccidentale e che dovrebbero ospitare 450.000 persone entro il 2026. Uno degli sviluppi, The Line, ha ricevuto la massima attenzione per essere progettata come una città completamente chiusa lunga 170 km, larga 200 metri e alta 500 metri. Più costosa di Neom City è la rete di trasporto transeuropea dell'UE. L'aggiornamento delle infrastrutture su larga scala, stimato in 600 miliardi di dollari, include la costruzione di linee ferroviarie, strade, rotte marittime e strutture correlate nei paesi membri dell'UE per migliorare il trasporto a lunga distanza. Altri megaprogetti nella regione includono il complesso di intrattenimento e turismo Dubailand, King Abdullah Economic City a nord di Jeddah in Arabia Saudita e Silk City nel nord del Kuwait, che ospiterà il futuro edificio più alto del mondo.
https://www.statista.com/chart/29653/megaprojects/
Apr 4, 2023
The World's Megaprojects
Right now, there are several projects underway that exceed the size of $100 billion - despite the fact that $10 billion construction proposals were considered to be megaproject just some years ago.
Out of all nine ongoing megaprojects identified by 1Build, International Construction Magazine and Construction Review to cost $100 billion or more, four were being built in Arab Gulf States. This includes the ambitious project of Neom City, actually a collection of futuristic towns and cities which are being built in Northwestern Saudi Arabia and are expected to house 450,000 people by 2026. One of the developments, The Line, has received the most attention for being planned as a completely enclosed city 170 km in length, 200 meters in width and 500 meters in height. More expensive than Neom City is the EU's Trans-European Transport Network. The large-scale infrastructure upgrade estimated to cost $600 billion includes the building of railway lines, roads, shipping routes and related structures in EU member countries to improve long-distance transport. Other megaprojects in the region include entertainment and tourism complex Dubailand, King Abdullah Economic City North of Jeddah in Saudi Arabia and Silk City in Northern Kuwait, which will be home to the world's future tallest building.
https://www.statista.com/chart/29653/megaprojects/
Gigafactories
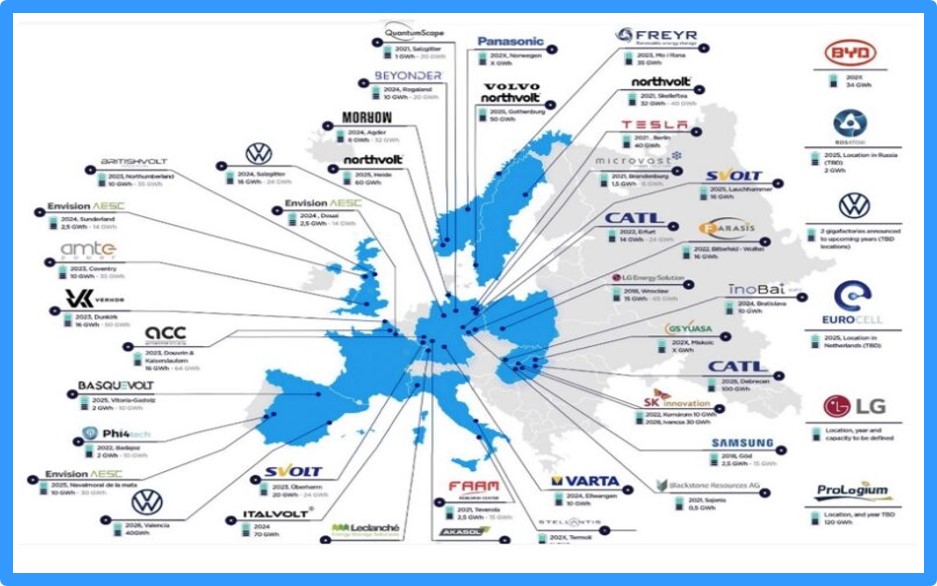
19 febbraio 2023
Le gigafactory sono le fabbriche di energia elettrica del futuro. Il primo progetto è stato della Tesla in America, ma adesso in Europa e in tutto il mondo si stanno realizzando queste unità gigantesche che produrranno batterie, principalmente per la mobilità elettrica. Nell’illustrazione (Europea Gigafactories Analysis by CIC energiGUE–09.2022) la mappa europea. Grossomodo si stima che entro il 2030 queste imprese produrranno una capacità di quasi 800 GWh.
https://www.faraday.ac.uk/news-ev-battery-prod-2040-update-june2022/
February 19, 2023
Gigafactories are the electricity factories of the future. The first project was by Tesla in America, but now these gigantic units are being built in Europe and all over the world which will produce batteries, mainly for electric mobility. In the illustration (Europea Gigafactories Analysis by CIC energiGUE–09.2022) the European map. Roughly it is estimated that by 2030 these companies will produce a capacity of almost 800 GWh.
https://www.faraday.ac.uk/news-ev-battery-prod-2040-update-june2022/
World risks
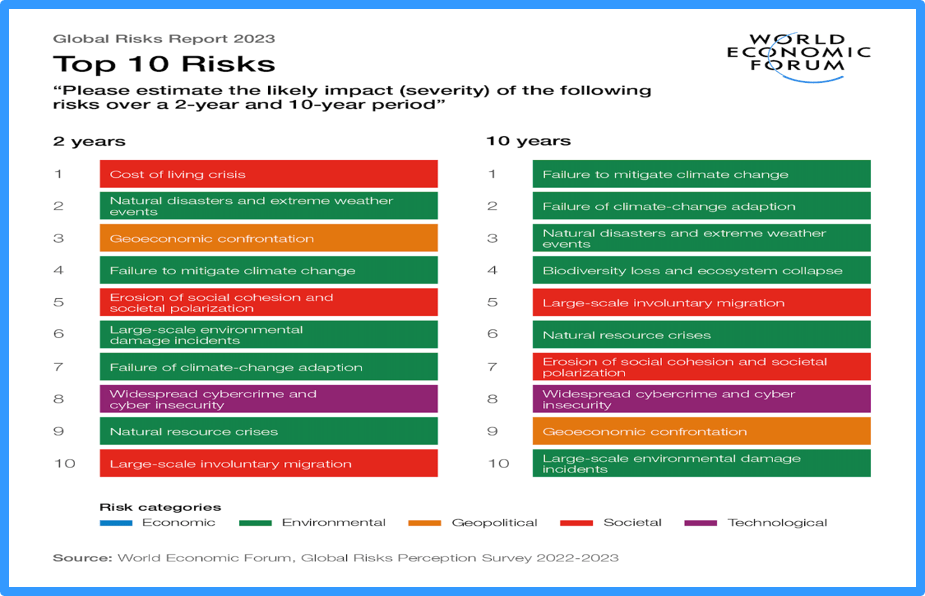
11 gennaio 2023
Il costo della vita dominerà i rischi globali nei prossimi due anni, mentre il fallimento dell'azione per il clima dominerà il prossimo decennio. Il prossimo decennio sarà caratterizzato da crisi ambientali e sociali, guidate da tendenze geopolitiche ed economiche sottostanti. La "crisi del costo della vita" è classificata come il rischio globale più grave nei prossimi due anni, con un picco nel breve termine. La "perdita di biodiversità e il collasso dell'ecosistema" è considerato uno dei rischi globali in più rapido deterioramento nel prossimo decennio e tutti e sei i rischi ambientali figurano tra i primi 10 rischi nei prossimi 10 anni. Nove rischi sono presenti nelle prime 10 classifiche sia a breve che a lungo termine, tra cui "Confronto geoeconomico" e "Erosione della coesione sociale e polarizzazione della società", insieme a due nuovi entranti nelle prime classifiche: "Criminalità informatica diffusa e insicurezza informatica" e "Migrazione involontaria su larga scala".
https://www.weforum.org/reports/global-risks-report-2023/digest
January 11, 2023
Cost of living dominates global risks in the next two years while climate action failure dominates the next decade. The next decade will be characterized by environmental and societal crises, driven by underlying geopolitical and economic trends. “Cost-of-living crisis” is ranked as the most severe global risk over the next two years, peaking in the short term. “Biodiversity loss and ecosystem collapse” is viewed as one of the fastest deteriorating global risks over the next decade, and all six environmental risks feature in the top 10 risks over the next 10 years. Nine risks are featured in the top 10 rankings over both the short and the long term, including “Geoeconomic confrontation” and “Erosion of social cohesion and societal polarisation”, alongside two new entrants to the top rankings: “Widespread cybercrime and cyber insecurity” and “Large-scale involuntary migration”.
https://www.weforum.org/reports/global-risks-report-2023/digest
Innovation trend
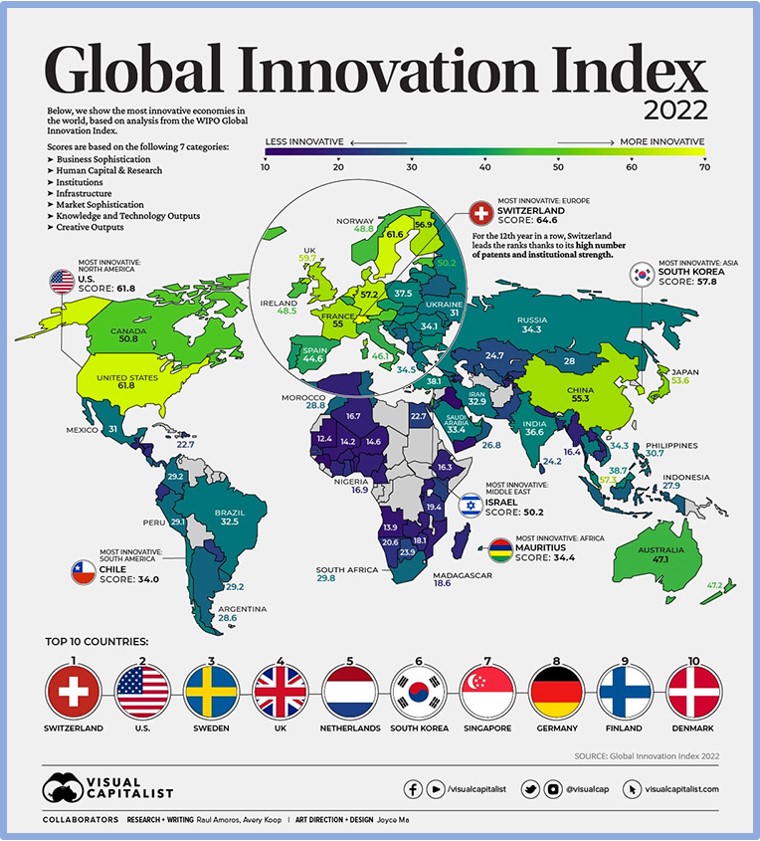
2 gennaio 2023
Global Innovation Index
Ogni anno, l'Organizzazione mondiale della proprietà intellettuale (OMPI) delle Nazioni Unite classifica i Paesi in base a quanto innovative siano le loro economie (Report di 266 pagine). Gli investimenti in scienza e innovazione hanno continuato a crescere, ottenendo buoni risultati anche al culmine di una pandemia che accade una volta ogni secolo. Anche i depositi di brevetti internazionali, la spesa in ricerca e sviluppo, le pubblicazioni scientifiche e altri parametri chiave dell'innovazione hanno mostrato una crescita continua, come la tendenza nelle operazioni di capitale di rischio – Venture Capital (VC). In genere, il pool di capitale disponibile per finanziare l'innovazione si riduce durante i periodi di turbolenza economica, con un calo degli investimenti in VC in linea con il ciclo economico complessivo. Tuttavia, l'attuale crisi ha invece visto un boom storico nell'attività di VC, con un aumento del numero di transazioni di quasi il 50% lo scorso anno.
https://www.globalinnovationindex.org/Home
January 2, 2023
Global Innovation Index
Every year, the UN’s World Intellectual Property Organization (WIPO) scores countries on how innovative their economies are (Report of 266 pages). Science and innovation investments continued to surge, performing strongly even at the height of a once in a century pandemic. International patent filings, R&D expenditure, scientific publications and other key innovation metrics also all showed continued growth. Take the trend in venture capital (VC) deals. Typically, the pool of capital available for financing innovation shrinks during periods of economic turbulence, with VC investment declining in line with the overall business cycle. However, the current crisis has instead seen a historic boom in VC activity, with the number of deals increasing by almost 50 per cent last year.
https://www.globalinnovationindex.org/Home
.
Spacejunk
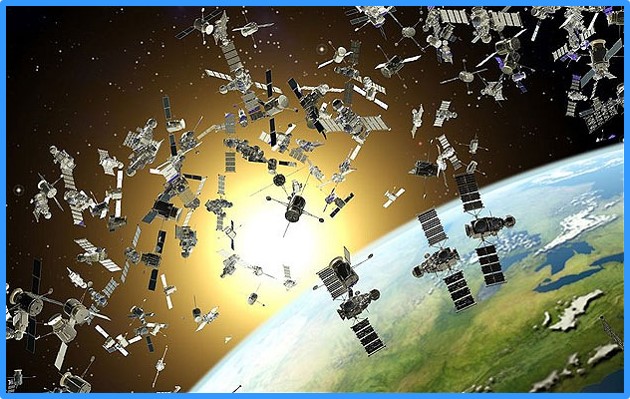
18 dicembre 2022
Spazzatura spaziale
Sono oltre 30.000 i detriti spaziali in orbita identificati e regolarmente monitorati per evitare collisioni, ma i modelli statistici stimano che potrebbero essercene addirittura più di un milione con dimensioni superiori al centimetro, e il loro numero è in continuo aumento. È quanto emerge dall’ultimo rapporto annuale sullo stato dell’ambiente spaziale stilato dall’Agenzia spaziale europea (Esa) nel 2022.
December 18, 2022
Spacejunk
There are over 30,000 space debris in orbit identified and regularly monitored to avoid collisions, but statistical models estimate that there could even be more than a million with dimensions greater than a centimeter, and their number is constantly increasing. This is what emerges from the latest annual report on the state of the space environment drawn up by the European Space Agency (ESA) in 2022.
GDP/PIL
Novembre 2022
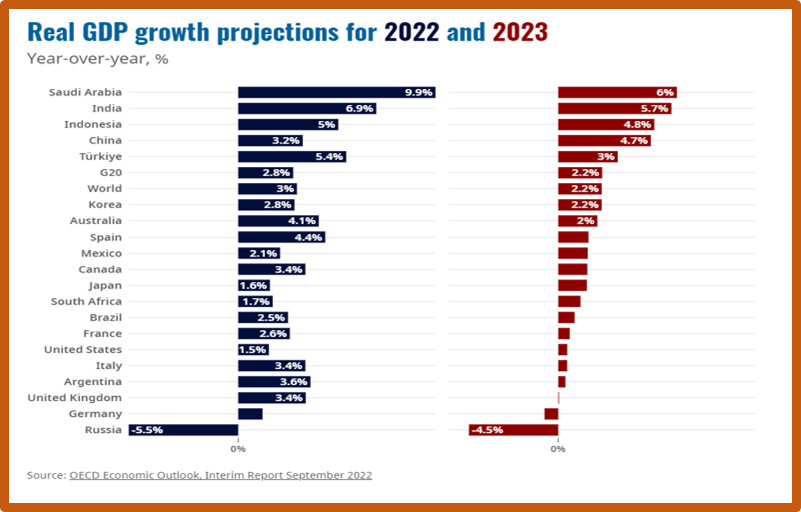
In economia, prodotto interno lordo (abbreviato PIL) è una grandezza macroeconomica che misura il valore aggregato, a prezzi di mercato, di tutti i beni e i servizi finali (cioè esclusi i prodotti intermedi) prodotti sul territorio di un Paese in un dato periodo temporale (normalmente si usa come riferimento l’anno solare).
L'economia mondiale sta rallentando più del previsto. Nonostante un aumento dell'attività con il calo delle infezioni da COVID-19 in tutto il mondo, si prevede che la crescita globale rimarrà contenuta nella seconda metà del 2022, prima di rallentare ulteriormente nel 2023 fino a una crescita annua di appena il 2,2%. Rispetto alle previsioni dell'OCSE del dicembre 2021, prima dell'aggressione della Russia contro l'Ucraina, si prevede che il PIL globale sarà ora inferiore di almeno 2,8 trilioni di dollari nel 2023. Ci sono molti costi per la guerra della Russia, ma questo dà un'idea del prezzo mondiale della guerra in termini di produzione economica. Un fattore chiave che rallenta la crescita globale è l'inasprimento generalizzato della politica monetaria, determinato dal superamento degli obiettivi di inflazione superiore al previsto. I rigidi blocchi associati alla politica zero COVID-19 della Cina hanno avuto un impatto anche sull'economia cinese e globale. Le chiusure e la debolezza del mercato immobiliare stanno rallentando la crescita della Cina a solo il 3,2% nel 2022.
Fonte: OECD Economic Outlook, Interim Report September 2022
https://www.oecd.org/economic-outlook/september-2022/
November, 2022
In economics, gross domestic product (abbreviated GDP) is a macroeconomic quantity that measures the aggregate value, at market prices, of all final goods and services (i.e. excluding intermediate products) produced in a country in a given time period (normally the calendar year is used as a reference).
The world economy is slowing more than anticipated. Despite a boost in activity as COVID-19 infections drop worldwide, global growth is projected to remain subdued in the second half of 2022, before slowing further in 2023 to an annual growth of just 2.2%. Compared to OECD forecasts from December 2021, before Russia’s aggression against Ukraine, global GDP is now projected to be at least USD 2.8 trillion lower in 2023. There are many costs to Russia’s war, but this gives some sense of the worldwide price of the war in terms of economic output.
A key factor slowing global growth is the generalised tightening of monetary policy, driven by the greater-than-expected overshoot of inflation targets. Strict lockdowns associated with China’s zero COVID-19 policy have also impacted the Chinese and global economy. Shutdowns and property market weakness are slowing China’s growth to just 3.2% in 2022.
Source: OECD Economic Outlook, Interim Report September 2022
https://www.oecd.org/economic-outlook/september-2022/
Europe’s environment
5 ottobre 2022
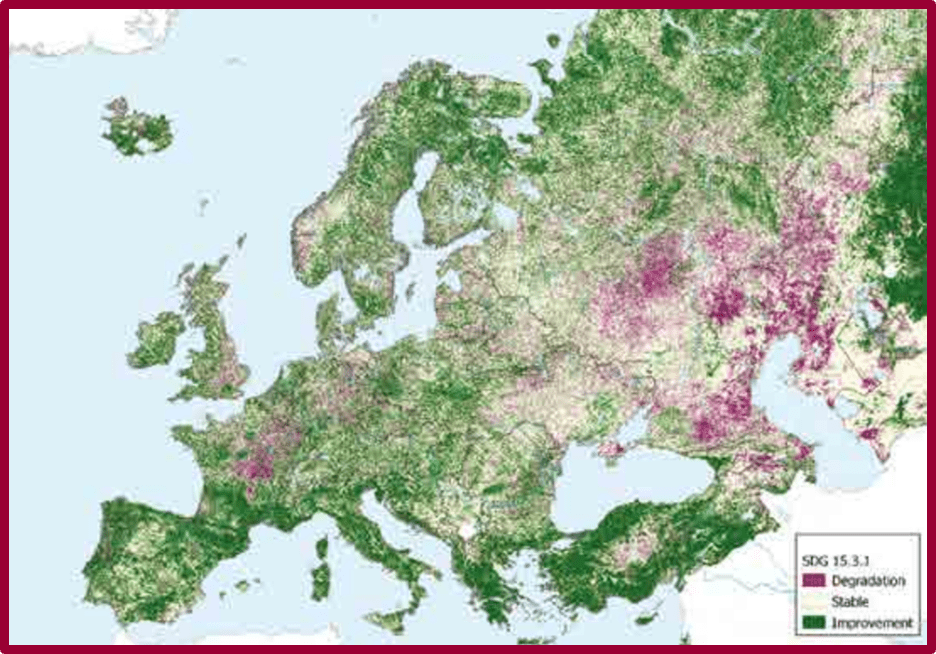
Tendenze del degrado del suolo nella regione paneuropea, 2005–2019
Fonte: Conservation International
https://unece.org/environment/documents/2022/04/informal-documents/europes-environment-seventh-pan-european
October 5, 2022
Trends in land degradation in the pan-European region, 2005–2019
Source: Conservation International
https://unece.org/environment/documents/2022/04/informal-documents/europes-environment-seventh-pan-european
Grandi città
17 settembre 2022
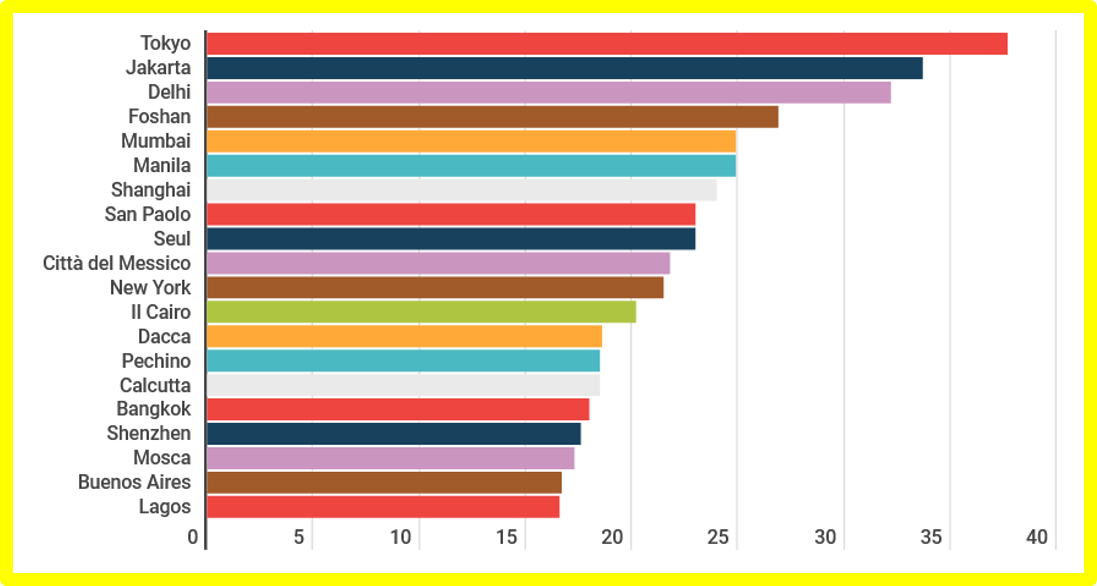
Aree urbane più popolate nel mondo
Oltre 2,3 miliardi di persone nel mondo (circa il 29% del totale) vivono in appena 990 grandi aree urbane (oltre i 500mila abitanti), di cui ben 524 concentrate in Asia: solo la Cina ne ospita oltre 200. Se invece consideriamo una città come un agglomerato urbano, ossia un’area priva di zone rurali, la più popolata è Tokyo, con oltre 37,7 milioni di abitanti. L’area urbana più popolata in Italia è quella di Milano, con circa 5,5 milioni di abitanti. È l’86esima più popolata del mondo, allo stesso livello di Atlanta negli Usa e San Pietroburgo in Russia. Per incontrare altre città italiane nella classifica delle aree urbane più popolate del mondo bisogna scendere al 151esimo posto con Napoli, 3,6 milioni di abitanti, e al 172esimo con Roma, 3,2 milioni. (Dati aggiornati al 2022. Fonte: Demographia World Urban Areas)
https://www.truenumbers.it/un-terzo-della-popolazione-mondiale-vive-in-appena-990-citta/
September 17, 2022
Most populated urban areas in the world
Over 2.3 billion people in the world (about 29% of the total) live in just 990 large urban areas (over 500 thousand inhabitants), of which 524 are concentrated in Asia: only China is home to over 200. A city like an urban agglomeration, ie an area without rural areas, the most populated is Tokyo, with over 37.7 million inhabitants. The most populated urban area in Italy is that of Milan, with about 5.5 million inhabitants. It is the 86th most populous in the world, on a par with Atlanta in the US and St. Petersburg in Russia. To meet other Italian cities in the ranking of the most populated urban areas in the world, it is necessary to go down to 151st place with Naples, 3.6 million inhabitants, and to 172nd with Rome, 3.2 million. (Data updated to 2022. Source: Demographia World Urban Areas)
https://www.truenumbers.it/un-terzo-della-popolazione-mondiale-vive-in-appena-990-citta/
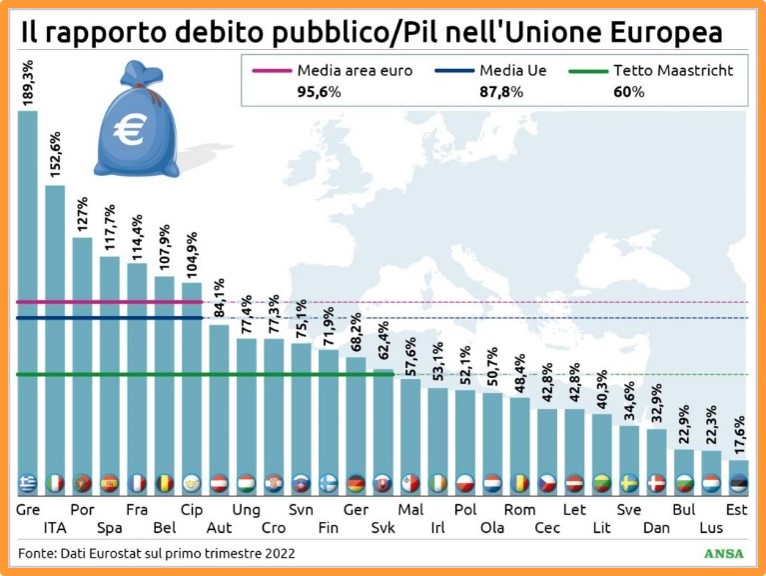
The public debt/GDP ratio in the European Union
Città bollenti - Hot cities
6 luglio 2022
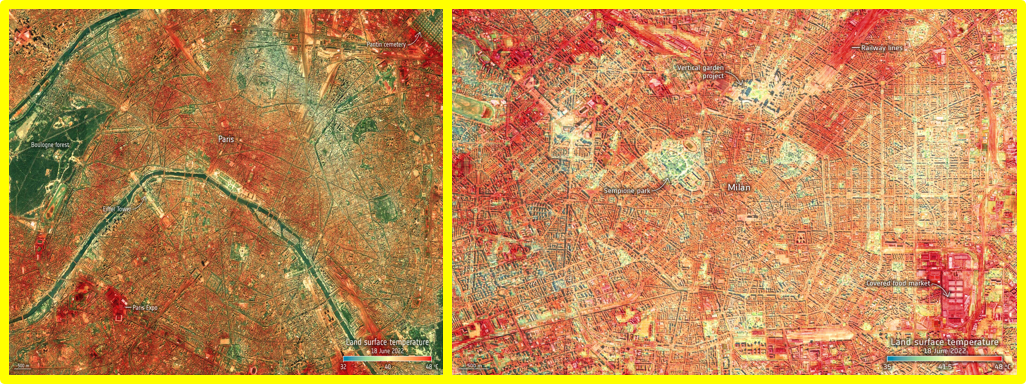
Temperatura della superficie terrestre a Parigi e a Milano il 18 giugno 2022
La NASA ha pubblicato le registrazioni le temperature del suolo di alcune città europee, realizzate con lo strumento ECOSTRESS della NASA, che viene trasportato sulla Stazione Spaziale Internazionale. Con temperature dell'aria superiori a 10°C al di sopra della media del periodo dell'anno in alcune parti d'Europa, giugno 2022 ha segnato un record. Le superfici più calde sono chiare da vedere: le linee ferroviarie, le strade e i mercati coperti, ad esempio, appaiono di un rosso brillante . Tuttavia, è anche evidente l'effetto rinfrescante dei parchi, della vegetazione e dell'acqua.
https://www.esa.int/ESA_Multimedia/Images/2022/07/Land-surface_temperature_in_Paris_on_18_June_2022
https://www.esa.int/ESA_Multimedia/Images/2022/07/Land-surface_temperature_in_Milan_on_18_June_2022
July 6, 2022
Earth surface temperature in Paris and Milan on June 18, 2022
NASA has published the recordings of the ground temperatures of some European cities, made with NASA's ECOSTRESS instrument, which is transported to the International Space Station. With air temperatures above 10° C above the average for the time of year in parts of Europe, June 2022 set a record. Warmer surfaces are clear to see: railway lines, streets and covered markets, for example, appear bright red. However, the refreshing effect of the parks, greenery and water is also evident.
https://www.esa.int/ESA_Multimedia/Images/2022/07/Land-surface_temperature_in_Paris_on_18_June_2022
https://www.esa.int/ESA_Multimedia/Images/2022/07/Land-surface_temperature_in_Milan_on_18_June_2022
Wind and solar
8 maggio 2022
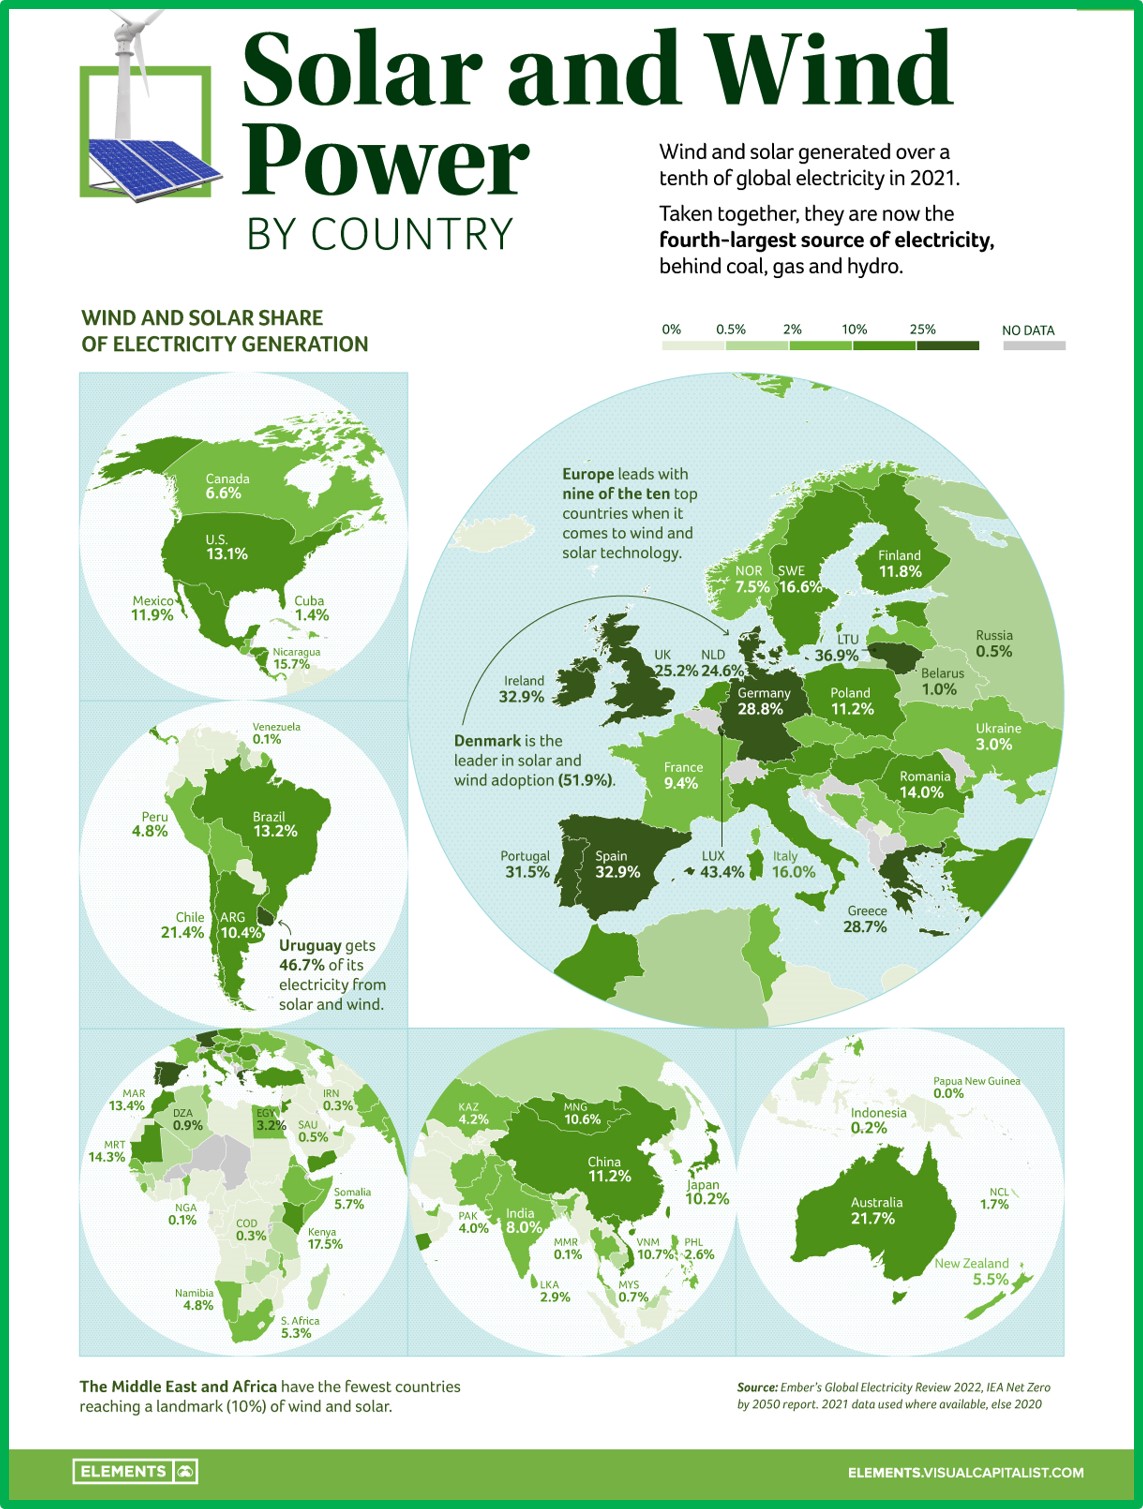
Eolico e solare
L'eolico e il solare generano oltre un decimo dell'elettricità mondiale. Presi insieme, sono la quarta fonte di elettricità, dietro carbone, gas e idroelettrico. Questa infografica basata sui dati di Ember mostra l'aumento dell'elettricità da queste due fonti pulite nell'ultimo decennio. L'Europa è leader nell'eolico e nel solare: l'eolico e il solare hanno generato per la prima volta il 10,3% dell'elettricità globale nel 2021, salendo dal 9,3% nel 2020 e raddoppiando la loro quota rispetto al 2015, quando è stato firmato l'accordo di Parigi sul clima. Infatti, 50 Paesi (26%) hanno generato oltre un decimo della loro elettricità da eolico e solare nel 2021, con sette paesi che hanno raggiunto questo traguardo per la prima volta: Cina, Giappone, Mongolia, Vietnam, Argentina, Ungheria ed El Salvador. Danimarca e Uruguay hanno ottenuto rispettivamente il 52% e il 47%, aprendo la strada alla tecnologia per l'integrazione di reti ad alta energia rinnovabile.
https://www.visualcapitalist.com/mapped-solar-and-wind-power-by-country/
May 8, 2022
Wind and solar
Wind and solar generate over a tenth of the world’s electricity. Taken together, they are the fourth-largest source of electricity, behind coal, gas, and hydro. This infographic based on data from Ember shows the rise of electricity from these two clean sources over the last decade. Europe Leads in Wind and Solar: wind and solar generated 10.3% of global electricity for the first time in 2021, rising from 9.3% in 2020, and doubling their share compared to 2015 when the Paris Climate Agreement was signed. In fact, 50 countries (26%) generated over a tenth of their electricity from wind and solar in 2021, with seven countries hitting this landmark for the first time: China, Japan, Mongolia, Vietnam, Argentina, Hungary, and El Salvador. Denmark and Uruguay achieved 52% and 47% respectively, leading the way in technology for high renewable grid integration.
https://www.visualcapitalist.com/mapped-solar-and-wind-power-by-country/
The $94 Trillion World Economy
Aprile 2022
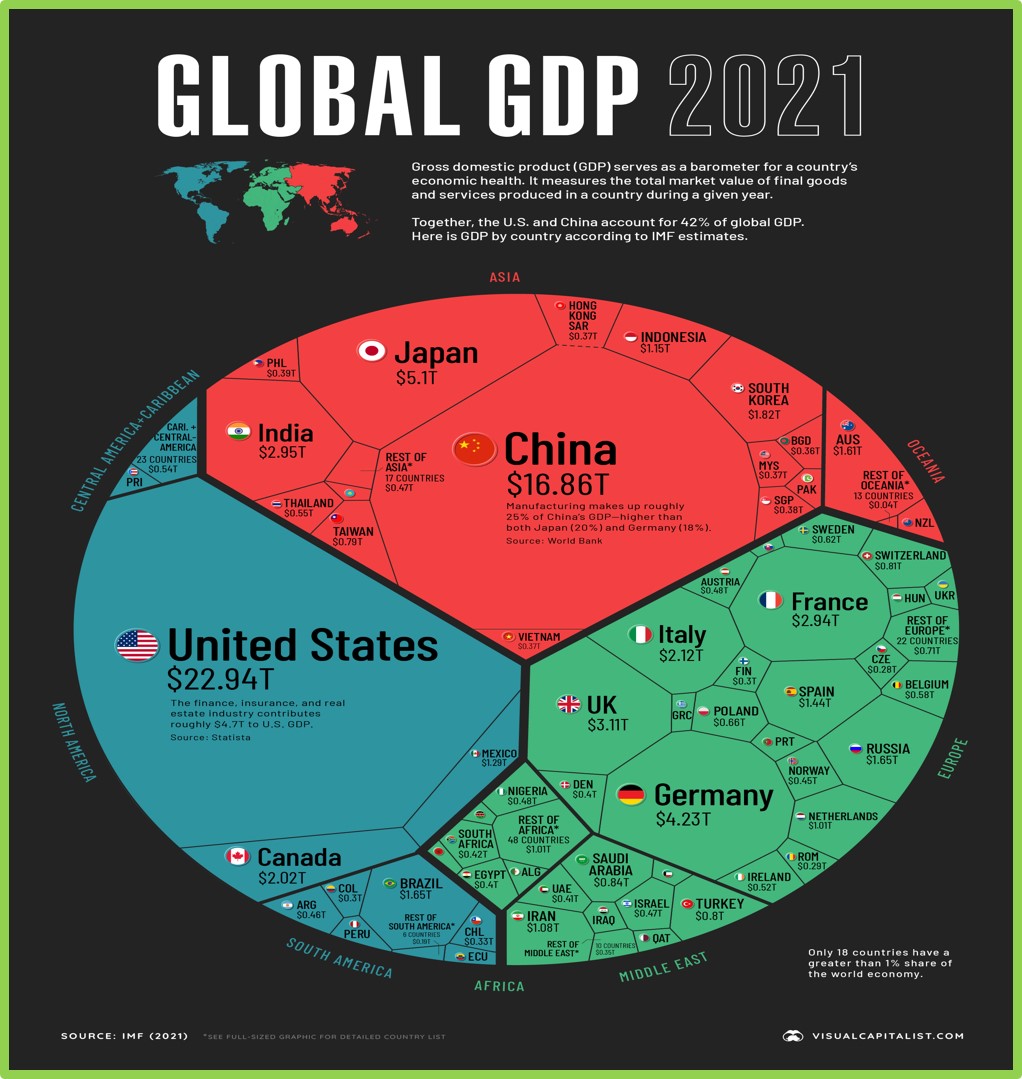
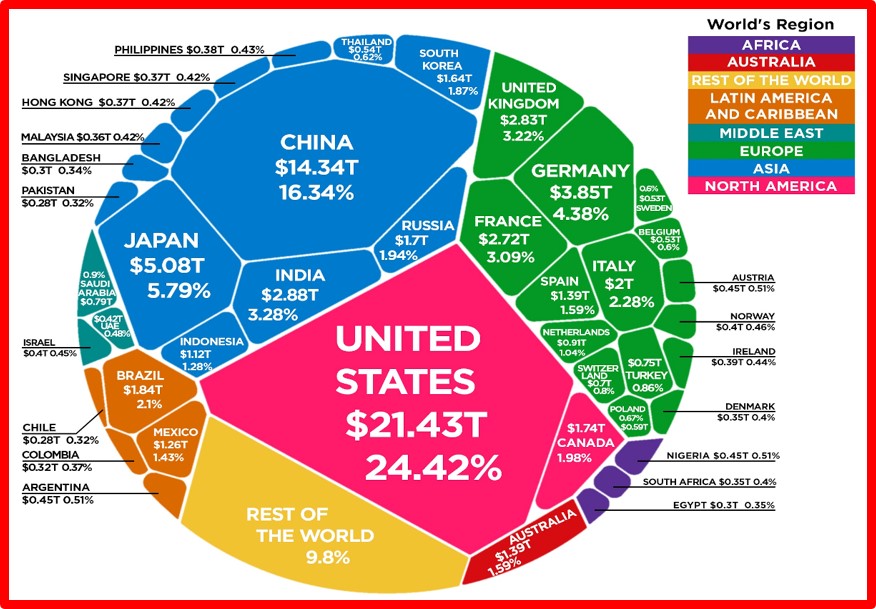
L'economia mondiale da 94 trilioni di dollari in un grafico.
Solo quattro Paesi - Stati Uniti, Cina, Giappone e Germania - rappresentano oltre la metà della produzione economica mondiale in termini di prodotto interno lordo (PIL) in termini nominali. In effetti, il PIL dei soli Stati Uniti è maggiore del PIL combinato di 170 Paesi. Il PIL funge da indicatore generale della produzione economica di un paese. Misura il valore di mercato totale dei beni e servizi finali prodotti in un paese in un periodo di tempo specifico, come un trimestre o un anno. Inoltre, il PIL tiene conto anche della produzione dei servizi forniti dal governo, come i soldi spesi per la difesa, l'assistenza sanitaria o l'istruzione. https://www.visualcapitalist.com/visualizing-the-94-trillion-world-economy-in-one-chart/
April 2022
The $94 Trillion World Economy in One Chart.
Just four countries—the U.S., China, Japan, and Germany—make up over half of the world’s economic output by gross domestic product (GDP) in nominal terms. In fact, the GDP of the U.S. alone is greater than the combined GDP of 170 countries. GDP serves as a broad indicator for a country’s economic output. It measures the total market value of final goods and services produced in a country in a specific timeframe, such as a quarter or year. In addition, GDP also takes into consideration the output of services provided by the government, such as money spent on defense, healthcare, or education. https://www.visualcapitalist.com/visualizing-the-94-trillion-world-economy-in-one-chart/
Be happy
Felicità mondiale
18 marzo 2022
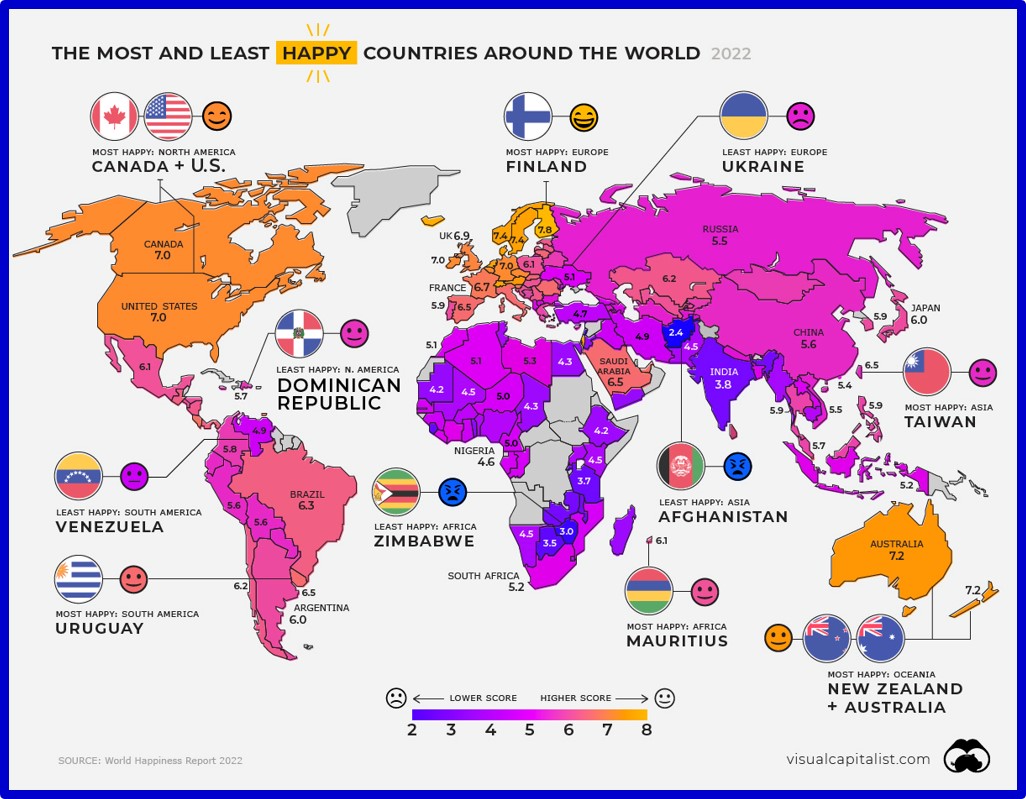
Questa mappa estrae i dati dal Rapporto sulla felicità nel mondo (World Happiness Report) per scoprire i punteggi medi di felicità di 146 Paesi. Mostra i punteggi medi dal 2019 al 2021 e mette in evidenza quali Paesi sono i più felici, o più infelici, e perché. Il report completo è recensito nella Sezione ‘Reports 2022’ di questo sito.
https://happiness-report.s3.amazonaws.com/2022/WHR+22.pdf
World Happiness
March 18, 2022
This map pulls data from the World Happiness Report to uncover the average happiness scores of 146 countries. It shows average scores from 2019 to 2021, and highlights which countries are the happiest—or unhappiest—and why. The full report is reviewed in the 'Reports 2022' section of this site.
https://happiness-report.s3.amazonaws.com/2022/WHR+22.pdf
Aggression against Ukraine
2 marzo 2022
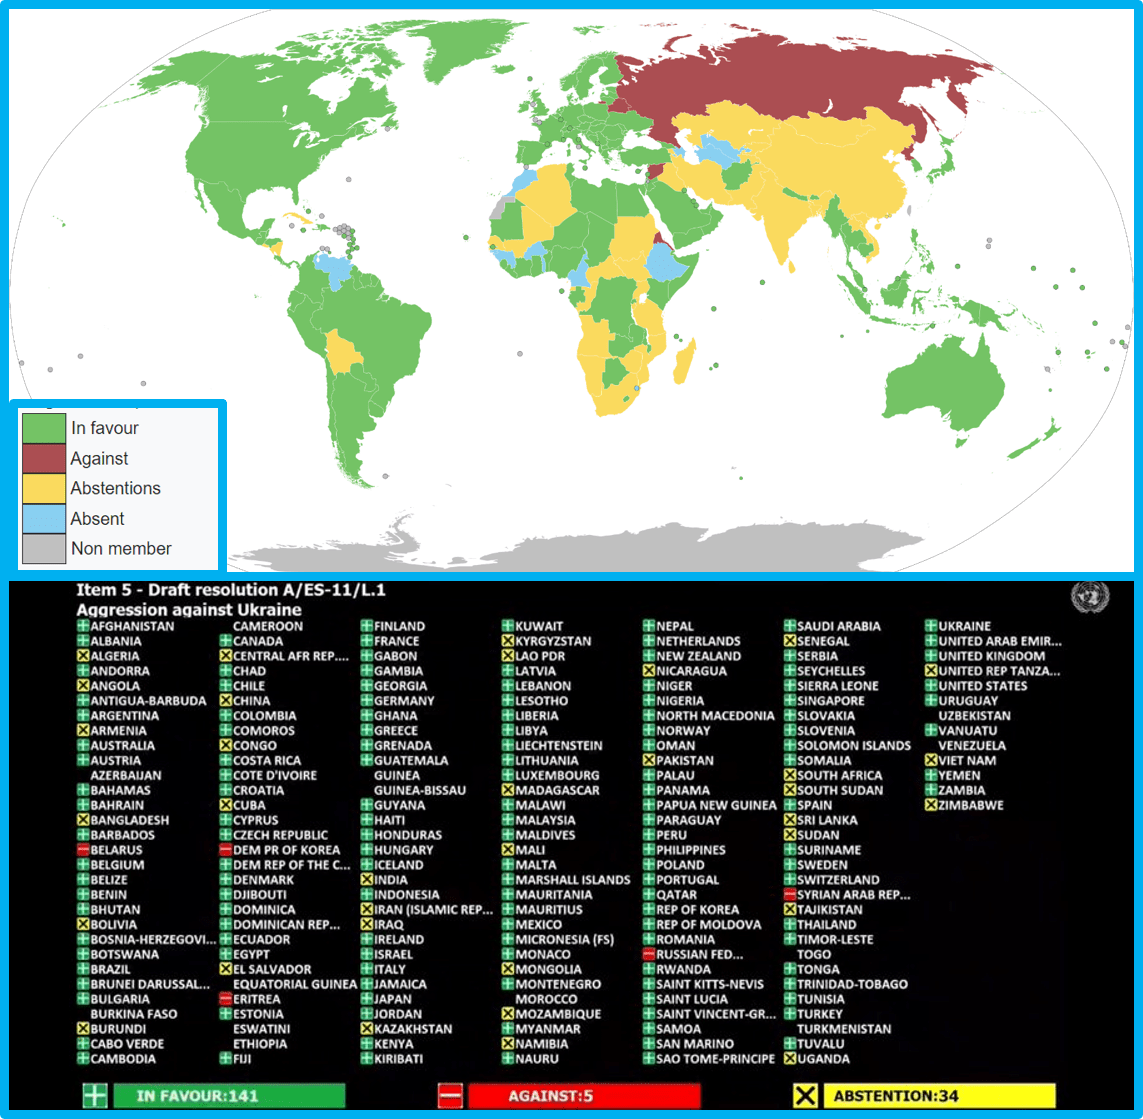
La mappa mostra i Paesi e le rispettive votazioni nella Risoluzione ES-11/1 dell'Assemblea generale delle Nazioni Unite.
La risoluzione ES-11/1 dell'Assemblea generale delle Nazioni Unite è una risoluzione dell'undicesima sessione speciale di emergenza dell'Assemblea generale delle Nazioni Unite, adottata il 2 marzo 2022. Deplora l'invasione russa dell'Ucraina e chiede il ritiro completo delle forze russe e l'annullamento della sua decisione di riconoscere le autoproclamate Repubbliche popolari di Donetsk e Luhansk. La risoluzione è stata sponsorizzata da 106 Paesi ed è stata approvata con 141 voti favorevoli, 5 contrari e 35 astenuti.
March 2, 2022
A map that shows the countries and their respective voting in the United Nations General Assembly resolution ES-11/1.
United Nations General Assembly Resolution ES 11/1 is a resolution of the eleventh emergency special session of the United Nations General Assembly, adopted on 2 March 2022. It deplored Russia's invasion of Ukraine and demanded a full withdrawal of Russian forces and a reversal of its decision to recognise the self-declared People's Republics of Donetsk and Luhansk. The resolution was sponsored by 106 countries, and passed with 141 voting in favour, 5 against, and 35 abstentions.
Democracy under pressure
Febbraio 2022
Democrazia dei governi
Da tempo si manifesta un'autocratizzazione strisciante: negli ultimi dieci anni, quasi una democrazia su cinque ha perso qualità, comprese le democrazie regionali importanti e un tempo stabili. Ma in molte autocrazie sono aumentate anche la repressione, l'abuso di potere e le restrizioni alla libertà di espressione e di riunione. Anche sette stati che due anni fa erano considerati "democrazie difettose" sono stati relegati ad autocrazie nell'ITV 2022. Nell'ultimo decennio si sono verificati cambiamenti di regime nella direzione opposta, ad esempio in Armenia, Sri Lanka e Tunisia. Ma gli sviluppi di queste giovani democrazie sono segnati da numerose regressioni.
https://www.bertelsmann-stiftung.de/de/themen/aktuelle-meldungen/2022/februar/demokratie-weltweit-unter-druck
February 2022
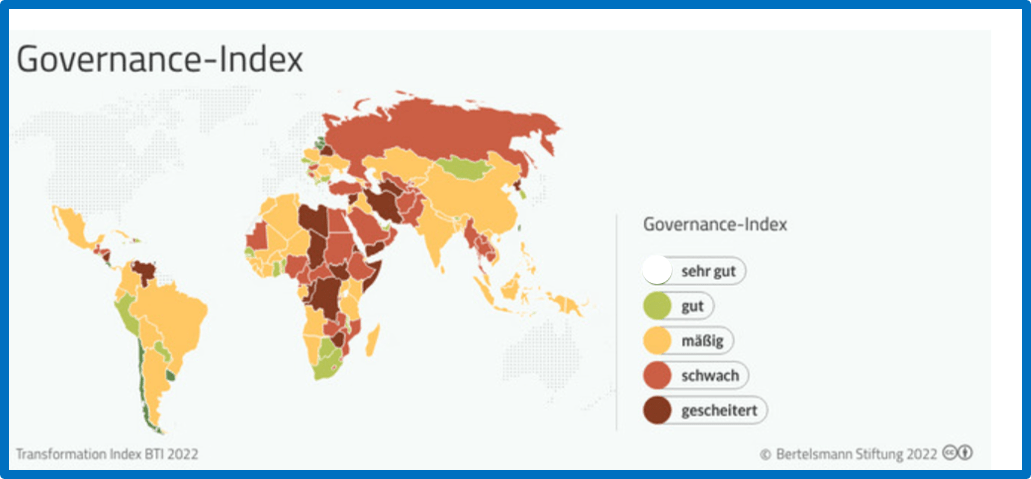
Governance Index
A creeping autocratization has been apparent for some time: in the past ten years, almost every fifth democracy has lost quality, including regionally important and once stable democracies. But repression, abuse of power and restrictions on freedom of expression and assembly have also increased in many autocracies. Seven states that were considered "defective democracies" two years ago have also been relegated to autocracies in the BTI 2022. In the past decade there have been regime changes in the opposite direction, for example in Armenia, Sri Lanka and Tunisia. But the developments in these young democracies are marked by numerous regressions.
https://www.bertelsmann-stiftung.de/de/themen/aktuelle-meldungen/2022/februar/demokratie-weltweit-unter-druck
Income geographic breakdown
Febbraio 2022
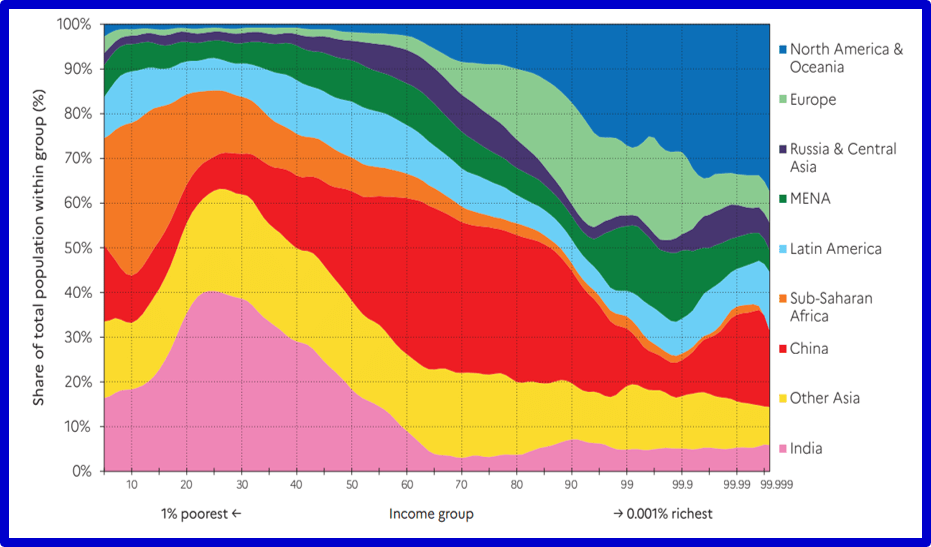
Ripartizione geografica dei gruppi di reddito globali nel 2021
Interpretazione: Il grafico mostra la ripartizione geografica dei gruppi di reddito globali. Nel 2021, il 18% della popolazione del gruppo di reddito dello 0,001% più ricco del mondo era residente in Cina. Reddito misurato al netto delle pensioni e delle indennità di disoccupazione percepite dagli individui e prima delle imposte sul reddito e sul patrimonio.
La figura fornisce un tipo di scomposizione geografica dei redditi globali. Il grafico presenta, per ciascun percentile della distribuzione globale del reddito, la quota di ciascuna regione. Europa e Nord America sono presenti quasi solo tra il 50% più ricco della distribuzione e ancor più nel 30% più ricco. Il grafico mostra anche che i Paesi emergenti e in via di sviluppo possono combinare sia una quota molto ampia di individui estremamente poveri sia una rappresentanza relativamente buona tra i gruppi di reddito più alti del mondo. Va notato che i dati di reddito sopra riportati sono misurati dopo le operazioni relative ai sistemi pensionistici e di disoccupazione (cioè dopo i contributi versati e i trasferimenti ricevuti dagli individui per le loro pensioni e i regimi pubblici di assicurazione contro la disoccupazione, ma prima altre tasse e trasferimenti che pagano e ricevono).
https://wir2022.wid.world/
February 2022
Geographic Breakdown of global income groups in 2021
Interpretation: The graph shows the geographical breakdown of global income groups. In 2021, 18% of the population of the world’s top 0.001% income group were residents of China. Income measured after pension and unemployment benefits are received by individuals, and before income and wealth taxes.
Figure provides a type of geographical decomposition of global incomes. The graph presents, for each percentile of the global income distribution, the share of each region. Europe and North America are almost only present between the top 50% of the distribution and more so in the top 30%. The graph also shows that emerging and developing countries can combine both a very large share of extremely poor individuals and a relatively good representation among the world’s top income groups. It should be noted that the income figures reported above are measured after operations related to pension and unemployment benefit systems (i.e. after contributions made and transfers received by individuals for their pensions and public unemployment insurance schemes, but before other taxes and transfers that they pay and receive).
https://wir2022.wid.world/
Income gaps
Febbraio 2022
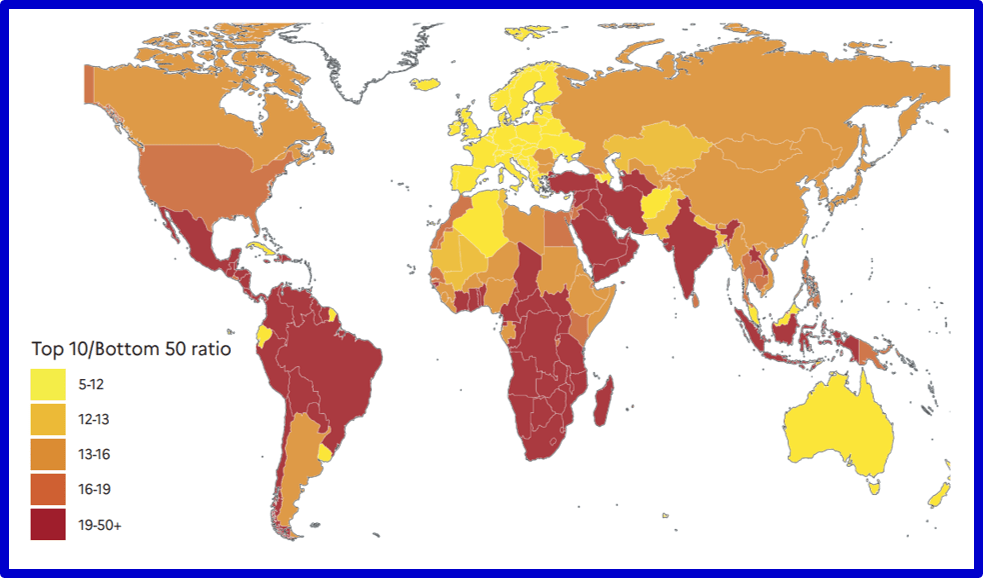
Divari di reddito nel mondo, 2021
Interpretazione: In Brasile, il 50% più povero guadagna 29 volte meno del 10% più ricco. Il valore è 7 in Francia. Il reddito è misurato al netto dei pagamenti di pensione e disoccupazione e dei benefici ricevuti dagli individui, ma prima delle altre tasse che pagano e dei trasferimenti che ricevono.
I redditi medi nazionali ci dicono poco sulla disuguaglianza. La mappa mondiale delle disuguaglianze rivela che i livelli di reddito medi nazionali sono scarsi predittori di disuguaglianza: tra i Paesi ad alto reddito, alcuni sono molto disuguali (come gli Stati Uniti), mentre altri sono relativamente uguali (es. Svezia ). Lo stesso vale per i Paesi a basso e medio reddito, con alcuni che mostrano disuguaglianza estrema (es. Brasile e India), livelli piuttosto alti (es. Cina) e livelli da moderati a relativamente bassi (es. Malesia, Uruguay). La disuguaglianza è una scelta politica, non un'inevitabilità. Le disuguaglianze di reddito e di ricchezza sono aumentate quasi ovunque dagli anni '80, a seguito di una serie di programmi di deregolamentazione e liberalizzazione che hanno assunto forme diverse nei diversi Paesi. L'aumento non è stato uniforme: alcuni Paesi hanno registrato aumenti spettacolari della disuguaglianza (tra cui Stati Uniti, Russia e India) mentre altri (Paesi europei e Cina) hanno registrato incrementi relativamente inferiori.
https://wir2022.wid.world/
February 2022
Income gaps across the world, 2021
Interpretation: In Brazil, the bottom 50% earns 29 times less than the top 10%. The value is 7 in France. Income is measured after pension and unemployment payments and benefits received by individuals but before other taxes they pay and transfers they receive.
Average national incomes tell us little about inequality. The world map of inequalities reveals that national average income levels are poor predictors of inequality: among high-income countries, some are very unequal (such as the US), while other are relatively equal (e.g. Sweden). The same is true among low- and middle-income countries, with some exhibiting extreme inequality (e.g. Brazil and India), somewhat high levels (e.g. China) and moderate to relatively low levels (e.g. Malaysia, Uruguay). Inequality is a political choice, not an inevitability. Income and wealth inequalities have been on the rise nearly everywhere since the 1980s, following a series of deregulationand liberalization programs which took different forms in different countries. The rise has not been uniform: certain countries have experienced spectacular increases in inequality (including the US, Russia and India) while others (European countries and China) have experienced relatively smaller rises.
https://wir2022.wid.world/
Educational Meetings
Dicembre 2021
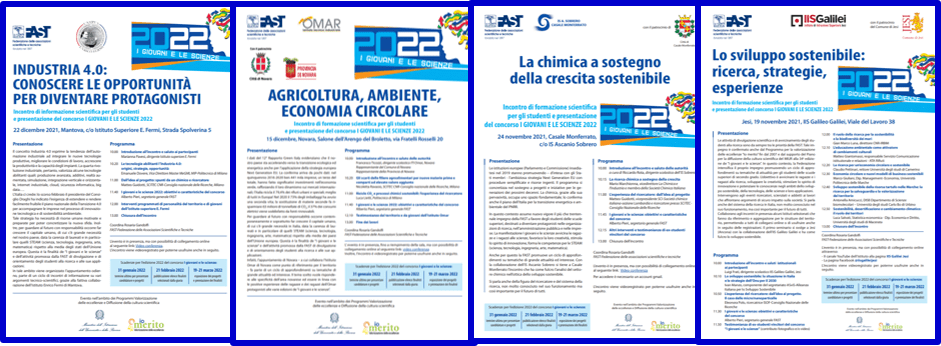
Incontri di formazione scientifica per studenti in Italia
Come preannunciato, a complemento delle attività connesse con il Concorso ‘I giovani e le scienze 2021’, organizzato dalla FAST e supportato dalla Fondazione Salvetti, sono stati realizzati 4 incontri con gli studenti (nell’immagine le locandine di presentazione), coordinati da Alberto Pieri, Segretario Generale della Fast e Membro della Fondazione Salvetti.
Jesi (AN), 19 novembre 2021: Lo sviluppo sostenibile: ricerca, strategie, esperienze.
Casale Monferrato (AL), 24 novembre 2021: La chimica a sostegno della crescita sostenibile.
Novara, Salone dell’Arengo del Broletto, 15 dicembre 2021: Agricoltura, ambiente, economia circolare.
Mantova, 22 dicembre 2021: Industria 4.0: conoscere le opportunità per diventare protagonisti.
https://fast.mi.it/
December 2021
Scientific educational meetings for students in Italy
As announced, in addition to the activities connected with the 'Young scientists 2021' contest, organized by FAST and supported by the Salvetti Foundation, 4 meetings were held with the students (in the image the presentation posters), coordinated by Alberto Pieri, Secretary General of Fast and Member of the Salvetti Foundation.
Jesi (AN), November 19, 2021: Sustainable development: research, strategies, experiences.
Casale Monferrato (AL), November 24, 2021: Chemistry in support of sustainable growth.
Novara, Salone dell’Arengo del Broletto, 15 December 2021: Agriculture, environment, circular economy.
Mantua, 22 December 2021: Industry 4.0: knowing the opportunities to become protagonists.
https://fast.mi.it/
Where is the sky cleaner?
DESI INDEX - Italia
13 novembre 2021
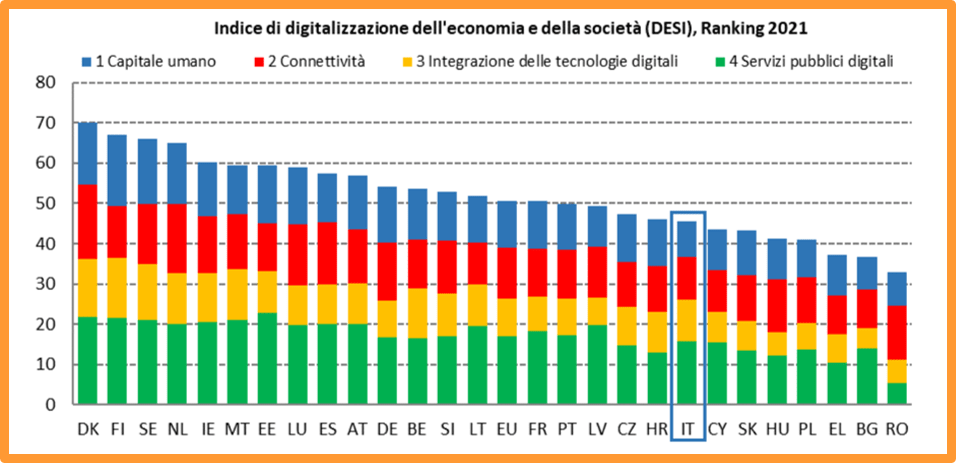
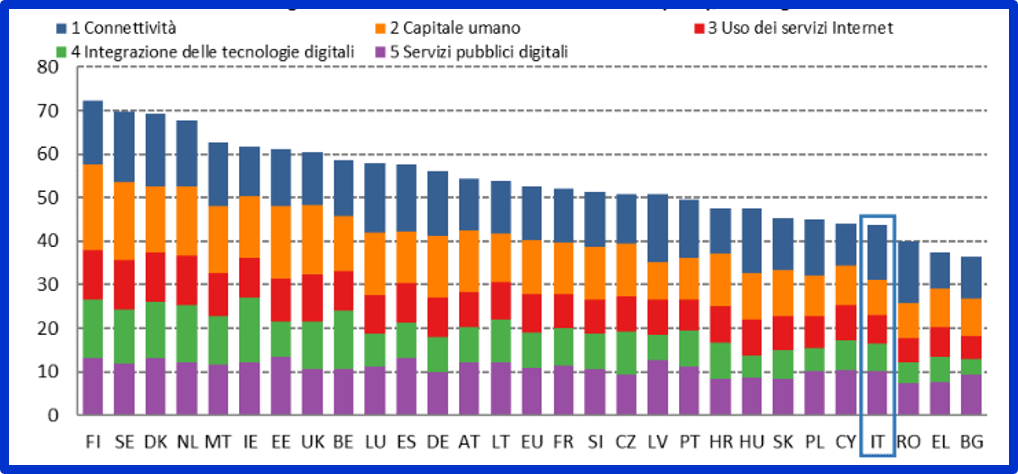
Indice di digitalizzazione dell'economia e della società.
La Commissione Europea ha pubblicato l’Indice di digitalizzazione dell'economia e della società (DESI) 2021. Per l'edizione 2021 l'Italia si colloca al 20º posto fra i 27 Stati membri dell'UE. Nel corso del 2020 l'Italia ha compiuto alcuni progressi in termini sia di copertura che di diffusione delle reti di connettività, con un aumento particolarmente significativo della diffusione dei servizi di connettività che offrono velocità di almeno 1 Gbps. Tuttavia il ritmo di dispiegamento della fibra è rallentato tra il 2019 e il 2020 e sono necessari ulteriori sforzi per aumentare la copertura delle reti ad altissima capacità e del 5G e per incoraggiarne la diffusione. Ecco il quadro complessivo dei Paesi europei, con l’evidenza della posizione italiana. Per ulteriori informazioni: https://digitalstrategy.ec.europa.eu/en/policies/desi
November 13, 2021
Digital Economy and Society Index
The European Commission has published the Digital Economy and Society Index (DESI) 2021. For the 2021 edition, Italy ranks 20th among the 27 EU member states. During 2020, Italy made some progress in terms of both coverage and diffusion of connectivity networks, with a particularly significant increase in the spread of connectivity services that offer speeds of at least 1 Gbps. However, the pace of fiber deployment slowed between 2019 and 2020 and further efforts are needed to increase coverage of ultra-high-capacity networks and 5G and to encourage their deployment. Here is the overall picture of the European countries, with the evidence of the Italian position. For more information: https://digital-strategy.ec.europa.eu/en/policies/desi-italy
Benvenuto G20 in Italia
30-31 ottobre 2021
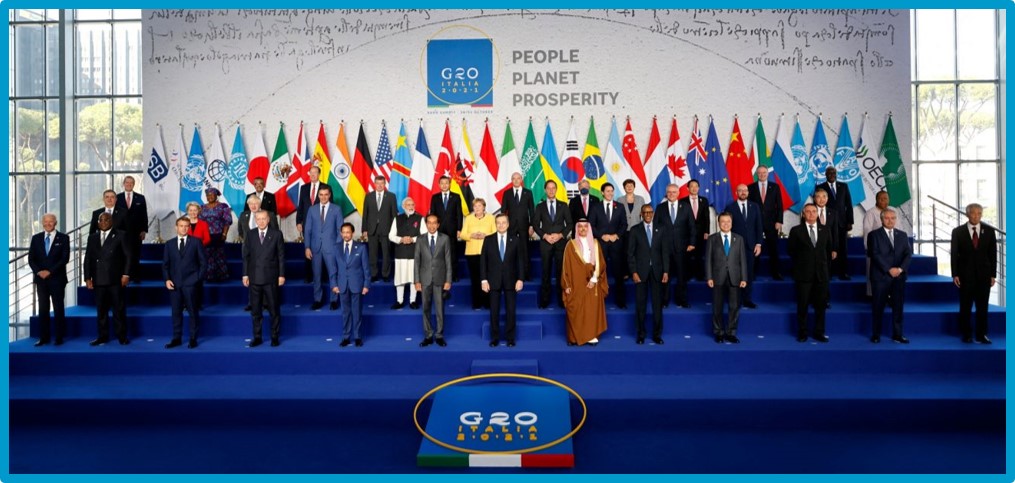
G20 Rome Summit, l'intervento di apertura del Presidente Draghi
Cari colleghi,
è un piacere darvi il benvenuto oggi a Roma per questo Vertice del G20. Innanzitutto, vorrei dire che è splendido vedervi tutti qui, dopo alcuni anni difficili per la comunità globale. Abbiamo affrontato il protezionismo, l’unilateralismo, il nazionalismo. La pandemia ci ha tenuti distanti - e lo ha fatto con tutti i nostri cittadini. Ma non dobbiamo fare errori. Il multilateralismo è la migliore risposta ai problemi che affrontiamo oggi. Per molti versi, è l’unica soluzione possibile. Dalla pandemia, al cambiamento climatico, a una tassazione giusta ed equa, fare tutto questo da soli, semplicemente, non è un’opzione possibile. Dobbiamo fare tutto ciò che possiamo per superare le nostre differenze. E dobbiamo riaccendere lo spirito che ci ha portati alla creazione e al rafforzamento di questo consesso. A circa due anni dall’inizio della pandemia, possiamo finalmente guardare al futuro con più ottimismo. Campagne vaccinali di successo e azioni coordinate da parte dei governi e delle banche centrali hanno permesso la ripresa dell’economia globale. Molti dei nostri Paesi hanno lanciato dei piani di ripresa per dare impulso alla crescita, ridurre le diseguaglianze, promuovere la sostenibilità. Insieme, stiamo costruendo un nuovo modello economico, e tutto il mondo ne beneficerà. Tuttavia, dobbiamo stare attenti alle sfide che affrontiamo collettivamente. La pandemia non è finita e ci sono disparità sconvolgenti nella distribuzione globale dei vaccini. Nei Paesi ad alto reddito, oltre il 70% della popolazione ha ricevuto almeno una dose. Nei Paesi più poveri, questa percentuale crolla a circa il 3%. Queste differenze sono moralmente inaccettabili, e minano la ripresa globale. Siamo molto vicini a raggiungere l’obiettivo posto dall’OMS di vaccinare il 40% della popolazione globale entro la fine del 2021. Ora dobbiamo fare tutto ciò che possiamo per raggiungere il 70% entro la metà del 2022. Dobbiamo anche continuare a investire in ricerca, eliminare le barriere commerciali che riguardano i vaccini anti COVID-19, e migliorare la prevedibilità nella loro consegna. E dobbiamo rafforzare le catene di approvvigionamento globali, aumentando al contempo la capacità produttiva a livello locale e regionale. Come Presidenza del G20, l’Italia ha lavorato per promuovere una ripresa più equa. Il Global Health Summit di Roma ha visto Paesi e aziende impegnarsi generosamente per fornire vaccini ai Paesi più poveri: dobbiamo essere sicuri di onorare le promesse. Abbiamo raggiunto un accordo storico per un sistema di tassazione internazionale più equo ed efficace. Abbiamo supervisionato l’allocazione di 650 miliardi di dollari come nuovi Diritti Speciali di Prelievo e abbiamo promosso la possibilità di redistribuirli ai Paesi che ne hanno più bisogno. Questi risultati ci ricordano con forza i risultati che possiamo raggiungere insieme. Ci devono incoraggiare ad essere altrettanto ambiziosi in tutte gli ambiti in cui lavoriamo insieme.
https://www.governo.it/it/articolo/g20-rome-summit-lintervento-di-apertura-del-presidente-draghi/18388
October 30-31, 2021
G20 Rome Summit, the opening speech by President Draghi
Dear colleagues,
It is a pleasure to welcome you in Rome today for this G20 Summit. First of all, I would like to say that it is great to see all of you here, after a difficult few years for the global community. The pandemic has kept us apart – as it did with all our citizens. And even before, we faced protectionism, unilateralism, nationalism. But the more we go with all our challenges, the more it is clear that multilateralism is the best answer to the problems we face today. In many ways, it is the only possible answer. From the pandemic, to climate change, to fair and equitable taxation, going it alone is simply not an option.
We must do all we can to overcome our differences. And we must rekindle the spirit that led to the creation of this group. Almost two years since the start of the pandemic, we can finally look at the future with great - or with some - optimism. Successful vaccination campaigns and coordinated action from governments and central banks have allowed the global economy to rebound.
Many of our countries have launched recovery plans to boost growth, reduce inequalities, promote sustainability. Together, we are building a new economic model, and the world will be all the better for it. However, we must be aware of the challenges we face collectively.
The pandemic is not over and there are startling disparities in the global distribution of vaccines. In high-income countries, more than 70 % of the population has received at least one dose. In the poorest ones, this percentage drops to roughly 3 %. These differences are morally unacceptable, and undermine the global recovery. We are very close to meeting the WHO’s target of vaccinating 40% of the global population by the end of 2021. Now we must do all we can to reach 70% by mid-2022.
We must also continue to invest in research, eliminate trade barriers affecting COVID-19 vaccines, and enhance predictability in their delivery.
And we need to strengthen supply chains, while expanding vaccine manufacturing capacity at local and regional level.
As G20 Presidency, Italy has worked to promote a more equitable recovery. The Global Health Summit in Rome saw countries and companies make generous vaccine pledges for poorer countries: we must make sure we honour them now. We reached a historic agreement for a fairer and more effective international tax system.
We oversaw the allocation of 650 billion dollars in new Special Drawing Rights and endorsed the possibility of redistributing them to the countries that are most in need.
These results are a powerful reminder of what we can achieve collectively.
They must encourage us to be just as ambitious in all the areas where we work together.
https://www.governo.it/it/articolo/g20-rome-summit-lintervento-di-apertura-del-presidente-draghi/18388
WebSoft Companies
29 ottobre 2021
Nel 2020 il fatturato aggregato dei 25 giganti WebSoft, ciascuno con un giro d’affari superiore ai 9 mld di euro, ha toccato 1.153 miliardi di euro. Stati Uniti e Cina si sono spartite la fetta maggiore dei ricavi: il 65% del fatturato WebSoft è stato generato dai colossi statunitensi, il 27% da quelli cinesi. La pandemia ha ulteriormente evidenziato il divario di velocità di crescita tra le WebSoft e le multinazionali manifatturiere: mentre le prime hanno accelerato (+45,5% i ricavi 2018-2020), le seconde hanno tirato il freno (-4,1%). Il mercato è sempre più concentrato: i primi tre player, Amazon, Alphabet e Microsoft, rappresentano la metà dei ricavi aggregati WebSoft nel 2020 e Amazon (314,6 miliardi di euro), in prima posizione dal 2014, ne concentra da sola oltre un quarto. (ByteDance, con TikTok, è in arrivo).
https://www.areastudimediobanca.com/it/product/report-websoft-ed-2021
October 29, 2021
In 2020, the aggregate turnover of the 25 WebSoft giants, each with a turnover exceeding 9 billion euros, reached 1,153 billion euros. The United States and China shared the largest share of revenues: 65% of WebSoft's turnover was generated by the US giants, 27% by the Chinese ones. The pandemic has further highlighted the growth speed gap between WebSofts and manufacturing multinationals: while the former accelerated (+ 45.5% 2018-2020 revenues), the latter pulled the brakes (-4.1%) . The market is increasingly concentrated: the top three players, Amazon, Alphabet and Microsoft, account for half of WebSoft's aggregate revenues in 2020 and Amazon (314.6 billion euros), in first position since 2014, alone concentrates more than one fourth. (ByteDance, with TikTok, is coming).
https://www.areastudimediobanca.com/it/product/report-websoft-ed-2021
Democracy Index
22 settembre 2021
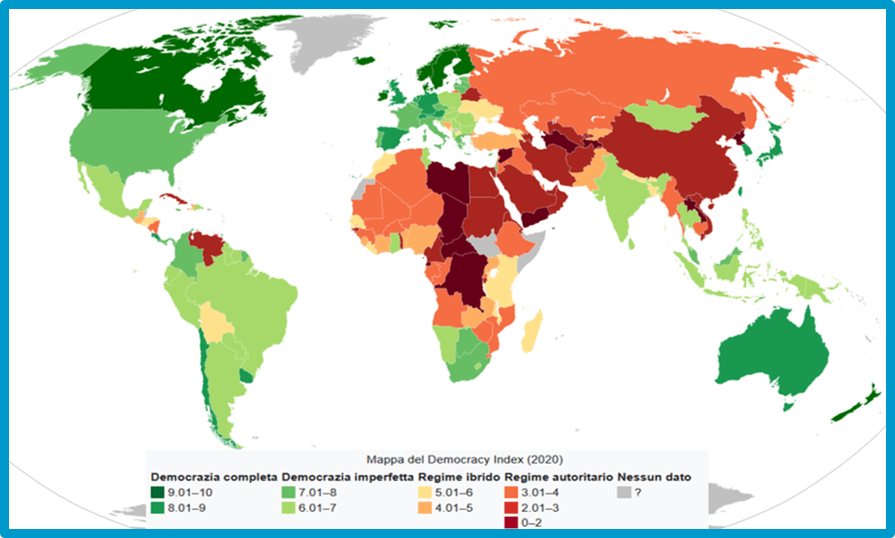
Indice di democrazia
Il Democracy Index è un indicatore calcolato dal settimanale The Economist che esamina lo stato della democrazia in 167 Paesi. Questo viene quantificato da l'Economist Intelligence Unit Index of Democracy che si concentra su cinque categorie generali: processo elettorale e pluralismo, libertà civili, funzione del governo, partecipazione politica e cultura politica. Le nazioni sono divise in quattro categorie: "Democrazie complete", "Democrazie imperfette", "Regimi Ibridi" e "Regimi autoritari". Secondo l'indagine del 2020, la Norvegia ottiene il risultato più alto con un punteggio di 9.81 su una scala da 0 a 10, mentre la Corea del Nord ottiene il più basso con 1.08. L'Italia con 7.74 si posiziona 29º, risultato che la qualifica come una nazione in cui vige una democrazia imperfetta.
https://it.wikipedia.org/wiki/Democracy_Index
September 22, 2021
Democracy Index
The Democracy Index is an index compiled by the Economist Intelligence Unit (EIU), the research division of the Economist Group, a UK-based private company which publishes the weekly newspaper The Economist. The index is self-described as intending to measure the state of democracy in 167 countries, of which 166 are sovereign states and 164 are UN member states. The index is based on 60 indicators grouped in five different categories, measuring pluralism, civil liberties and political culture. In addition to a numeric score and a ranking, the index categorises each country into one of four regime types: full democracies, flawed democracies, hybrid regimes and authoritarian regimes.
https://en.wikipedia.org/wiki/Democracy_Index
Nuclear power plants
Agosto 2021
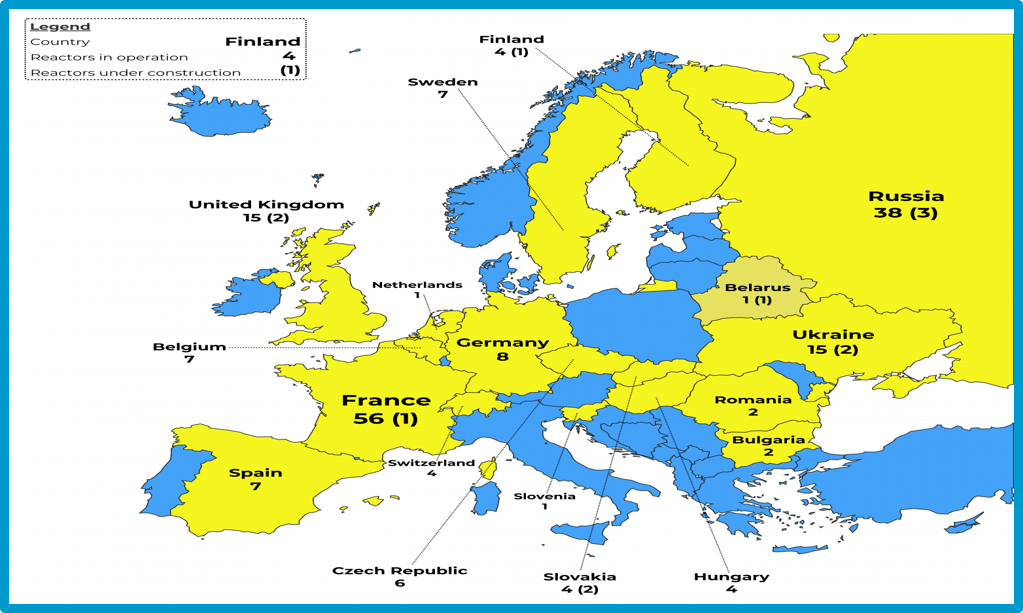
Centrali nucleari in Europa
Centrali nucleari in Europa, in funzione e in costruzione, al 22 febbraio 2021 In termini di elettricità generata dall'energia nucleare. Ad agosto 2020 erano in funzione in Europa un totale di 176 unità di centrali nucleari con una capacità elettrica netta installata di 159.719 MWe (di cui sei nella parte asiatica della Federazione Russa) e 13 unità con una capacità elettrica netta di 12.596 MWe erano in costruzione in sette paesi. (Mwe = megawatt elettrico = 1 milione di watt)
https://www.euronuclear.org/glossary/nuclear-power-plants-in-europe/
August 2021
Nuclear power plants in Europe
Nuclear power plants in Europe, in operation and under construction, as of 22 February 2021.
As of August 2020 there is a total of 176 nuclear power plant units with an installed electric net capacity of 159,719 MWe in operation in Europe (six thereof in the Asian part of the Russian Federation) and 13 units with an electric net capacity of 12,596 MWe were under construction in seven countries. (The electric megawatt is equal to one million (106) watts).
https://www.euronuclear.org/glossary/nuclear-power-plants-in-europe/
Climate change
Luglio 2021
Cambiamento climatico e anidride carbonica.
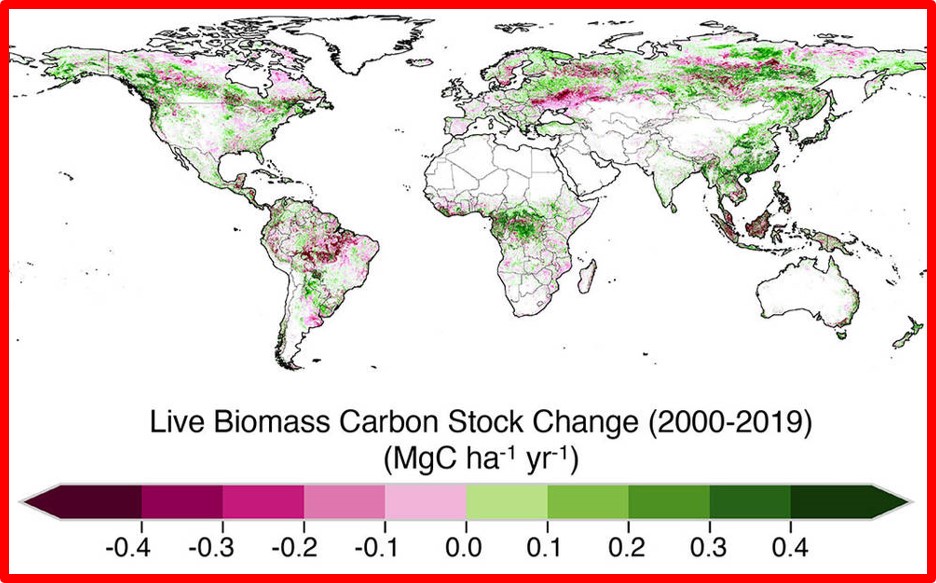
Un recente studio condotto dagli scienziati del Jet Propulsion Laboratory della NASA nel sud della California ha identificato se le aree con vegetazione come foreste e savane in tutto il mondo fossero fonti o purificatori di carbonio ogni anno dal 2000 al 2019. La ricerca ha scoperto che nel corso di quei due decenni le piante legnose erano responsabili di oltre l'80% delle fonti e delle purificazioni sulla terra, con suolo, lettiera e materia organica in decomposizione che costituivano il resto. Ma hanno anche visto che la vegetazione conservava una frazione di carbonio molto più piccola di quanto gli scienziati pensassero inizialmente. Questa mappa mostra la variazione della quantità di carbonio immagazzinata o emessa da un'area con vegetazione tra gli anni 2000 e 2019. Le aree più verdi hanno assorbito più carbonio di quanto emesso, mentre più regioni rosa e viola hanno rilasciato più carbonio di quanto ne hanno immagazzinato. Un megagrammo di carbonio (MgC) è una tonnellata.
July 2021
Climate change and carbon dioxide
A recent study led by scientists at NASA’s Jet Propulsion Laboratory in Southern California identified whether vegetated areas like forests and savannas around the world were carbon sources or sinks every year from 2000 to 2019. The research found that over the course of those two decades, living woody plants were responsible for more than 80% of the sources and sinks on land, with soil, leaf litter, and decaying organic matter making up the rest. But they also saw that vegetation retained a far smaller fraction of the carbon than the scientists originally thought. This map shows the change in how much carbon a vegetated area stored or emitted between the years 2000 and 2019. Greener areas absorbed more carbon than they emitted, while more pink and purple regions released more carbon than they stored. One megagram of carbon (MgC) is one metric ton.
https://climate.nasa.gov/vital-signs/carbon-dioxide/
Energy
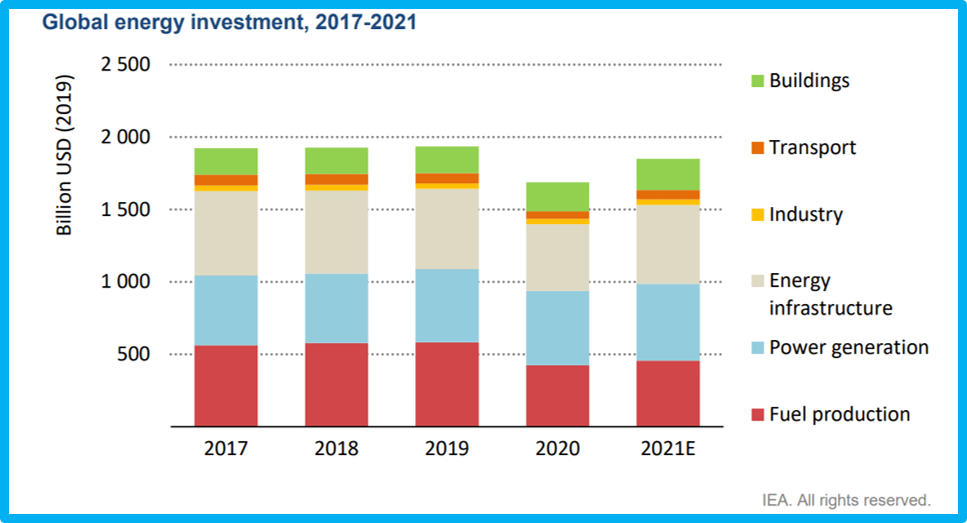
12 giugno 2021
Nel 2021, gli investimenti energetici globali annui dovrebbero salire a 1,9 trilioni di dollari, rimbalzando di quasi il 10% dal 2020 e riportando il volume totale degli investimenti ai livelli pre-crisi. Tuttavia, la composizione si è spostata verso i settori dell'energia e degli usi finali e lontano dalla tradizionale produzione di carburante. Le prospettive di investimento sono nettamente migliorate insieme alla crescita economica, sebbene vi siano significative variazioni da Paese a Paese. La domanda globale di energia è destinata ad aumentare del 4,6% nel 2021, più che compensando la contrazione del 4% nel 2020, secondo le ultime stime dell'AIE. Mentre molte compagnie energetiche rimangono in uno stato finanziario fragile, ci sono segni che gli sviluppatori stiano usando la finestra fornita dalla politica monetaria accomodante e dal sostegno del governo per pianificare sviluppi infrastrutturali e investimenti in nuovi progetti.
https://www.iea.org/reports/world-energy-investment-2021
June 12, 2021
In 2021, annual global energy investment is set to rise to USD 1.9 trillion, rebounding nearly 10% from 2020 and bringing the total volume of investment back towards pre-crisis levels. However, the composition has shifted towards power and end-use sectors – and away from traditional fuel production. Prospects for investment have improved markedly along with economic growth, although there are significant country-by-country variations. Global energy demand is set to increase by 4.6% in 2021, more than offsetting the 4% contraction in 2020, according to the latest IEA estimates. While many energy companies remain in a fragile financial state, there are signs developers are using the window provided by accommodative monetary policy and government backing to plan infrastructure developments and investments in new projects.
https://www.iea.org/reports/world-energy-investment-2021
Older Europeans
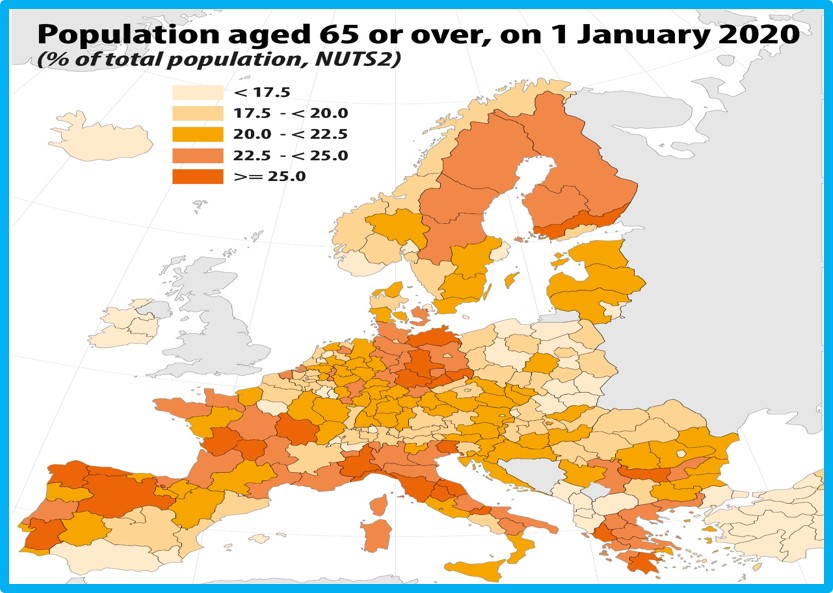
16 marzo 2021
Nel 2020, il 20,6% della popolazione dell'UE aveva un'età pari o superiore a 65 anni. Negli Stati membri dell'UE, la percentuale più alta di anziani sulla popolazione totale nel 2020 è in Italia (23,2%), seguita da Grecia e Finlandia (22,3% ciascuna), Portogallo (22,1%), Germania (21,8%) e Bulgaria (21,6%). Le quote più basse sono state registrate in Irlanda (14,4%) e in Lussemburgo (14,5%). © Tyler Olson / Shutterstock.com
https://ec.europa.eu/eurostat/web/products-eurostat-news/-/ddn-20210316-1?redirect=%2Feurostat%2Fhome%3F
March 16, 2021
In 2020, 20.6% of the EU population was aged 65 years or over. Across the EU Member States, the highest share of the elderly in the total population in 2020 was observed in Italy (23.2%), followed by Greece and Finland (22.3% each), Portugal (22.1%), Germany (21.8%) and Bulgaria (21.6%). The lowest shares were recorded in Ireland (14.4%) and in Luxembourg (14.5%). © Tyler Olson / Shutterstock.com
https://ec.europa.eu/eurostat/web/products-eurostat-news/-/ddn-20210316-1?redirect=%2Feurostat%2Fhome%3F
Mare Plasticum
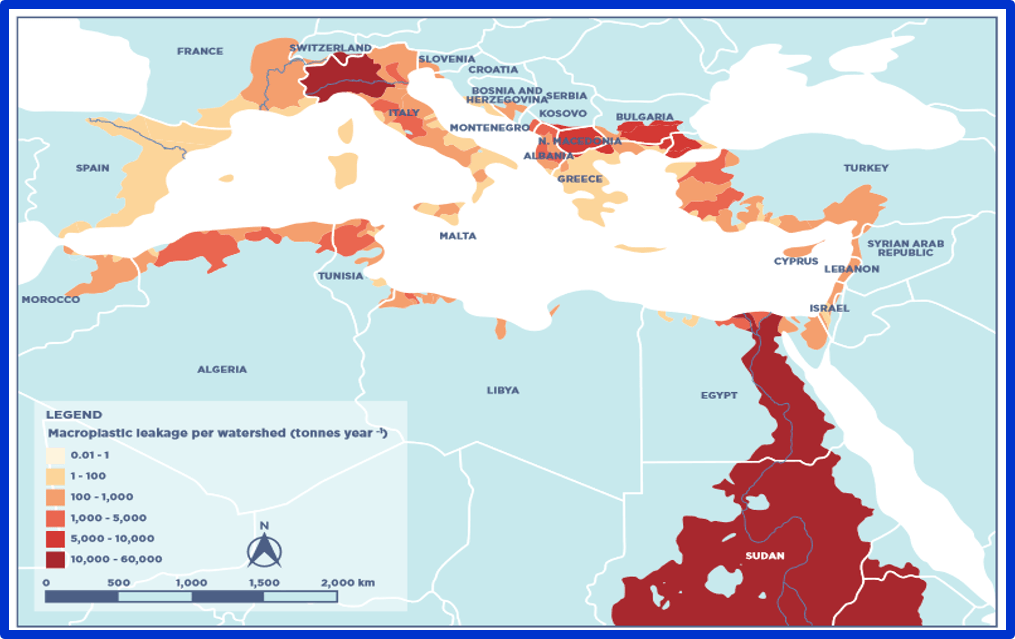
28 febbraio 2021
Mediterraneo: Mare Plasticum.
Perdita di macroplastica da rifiuti mal gestiti nel Mar Mediterraneo, vista spartiacque. A scopo di presentazione, non vengono mostrati i Paesi a monte del fiume Nilo. Sono responsabili del 9% della perdita totale.
(INTERNATIONAL UNION FOR CONSERVATION OF NATURE - https://portals.iucn.org/library/node/49124)
February 28, 2021
The Mediterranean: Mare Plasticum.
Leakage of macroplastic from mismanaged waste into the Mediterranean Sea, watershed view. For presentation purposes, the countries upstream of the Nile river are not shown. They are responsible for 9% of the total leakage
(INTERNATIONAL UNION FOR CONSERVATION OF NATURE - https://portals.iucn.org/library/node/49124)
Renewables
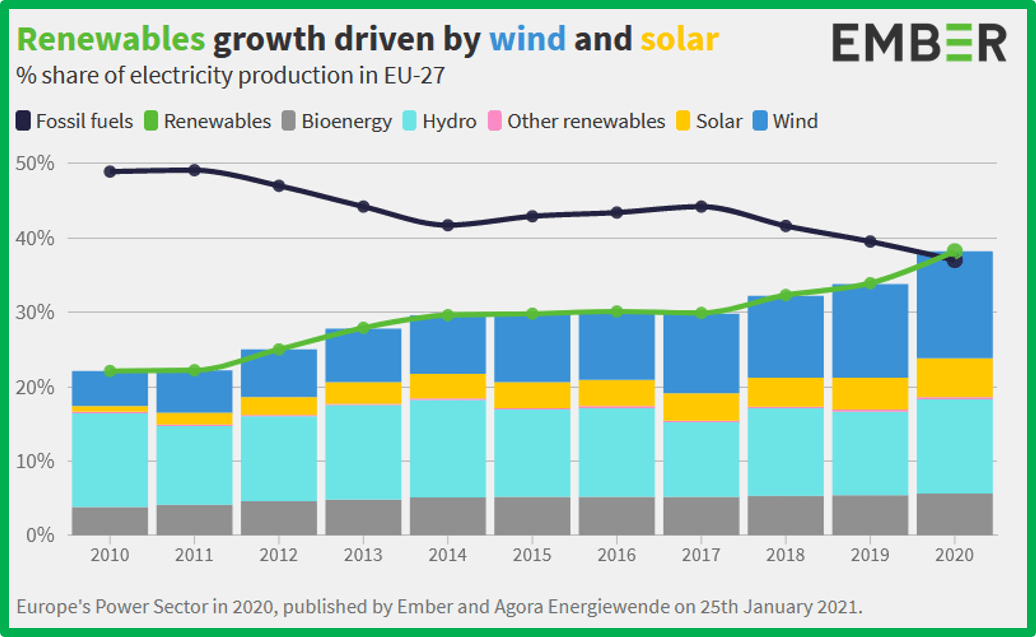
9 febbraio 2021
L'eolico e il solare hanno alimentato la crescita delle energie rinnovabili in Europa. L'eolico e il solare hanno generato un quinto dell'elettricità europea nel 2020. L'eolico ha fornito il 14% dell'elettricità europea, rispetto al 9% nel 2015, e il solare ha fornito il 5%, rispetto al 3% nel 2015. La crescita della bioenergia è rallentata nell'ultimo decennio e è in stallo dal 2018. La nuova capacità idroelettrica è prossima allo zero, i cambiamenti nella produzione idroelettrica sono guidati solo dai cambiamenti delle precipitazioni.
https://ember-climate.org/project/eu-power-sector-2020/
February 9, 2021
Wind and solar have powered Europe’s renewables rise. Wind and solar generated a fifth of Europe’s electricity in 2020. Wind supplied 14% of Europe’s electricity, up from 9% in 2015, and solar supplied 5%, up from 3% in 2015. Bioenergy growth slowed throughout the last decade and has stalled since 2018. New hydro capacity is near-zero, the changes in hydro generation are driven only by precipitation changes.
https://ember-climate.org/project/eu-power-sector-2020/
Global economy
Ottobre 2020
L'economia mondiale da 88 trilioni di dollari in un grafico
L'economia globale può sembrare un concetto astratto, eppure influenza la nostra vita quotidiana in modi sia ovvi che sottili. Da nessuna parte questo è più chiaro che nello stato economico attuale in mezzo alla pandemia. Questa visualizzazione di HowMuch si basa sui dati del prodotto interno lordo (PIL) della Banca Mondiale per dipingere un quadro dell'economia globale, che ha raggiunto $ 87,8 trilioni nel 2019. Nota: i dati annuali sulla produzione economica sono un indicatore in ritardo e vengono pubblicati l'anno successivo da organizzazioni come la Banca mondiale. Le cifre in questo diagramma forniscono un'istantanea dell'economia globale nel 2019, ma non rappresentano necessariamente l'impatto dei recenti sviluppi come COVID-19.
https://www.visualcapitalist.com/the-88-trillion-world-economy-in-one-chart/
October 2020
The $88 Trillion World Economy in One Chart
The global economy can seem like an abstract concept, yet it influences our everyday lives in both obvious and subtle ways. Nowhere is this clearer than in the current economic state amid the throes of the pandemic. This visualization from HowMuch relies on gross domestic product (GDP) data from the World Bank to paint a picture of the global economy—which crested $87.8 trillion in 2019. Note: Annual data on economic output is a lagging indicator, and is released the following year by organizations such as the World Bank. The figures in this diagram provide a snapshot of the global economy in 2019, but do not necessarily represent the impact of recent developments such as COVID-19.
https://www.visualcapitalist.com/the-88-trillion-world-economy-in-one-chart/
11 giugno 2020
Ranking 2020 – Indice di digitalizzazione dell’economia e della società
Per l'edizione 2020 dell‘Indice di digitalizzazione dell'economia e della società (DESI), pubblicata dalla Commissione Europea, l'Italia, rispetto alla media UE, registra livelli di competenze digitali di base e avanzate molto bassi. Solo il 74% degli italiani usa abitualmente Internet. Sebbene il paese si collochi in una posizione relativamente alta nell'offerta di servizi pubblici digitali(e-government), il loro utilizzo rimane scarso. Analogamente, le imprese italiane presentano ritardi nell'utilizzo di tecnologie come il cloud e i big data, così come per quanto riguarda l'adozione del commercio elettronico.
https://d110erj175o600.cloudfront.net/wp-content/uploads/2020/06/report-italia.pdf
June 11, 2020
Ranking 2020 - Digitization index of the economy and society
For the 2020 edition of the Digitization Index of the Economy and Society (DESI), published by the European Commission, Italy, compared to the EU average, has very low basic and advanced digital skills levels. Only 74% of Italians habitually use the Internet. Although the country has a relatively high position in the offer of digital public services (e-government), their use remains low. Similarly, Italian companies experience delays in the use of technologies such as cloud and big data, as well as with regards to the adoption of electronic commerce.
https://d110erj175o600.cloudfront.net/wp-content/uploads/2020/06/report-italia.pdf
2020 Projected change in GDP
10 giugno 2020
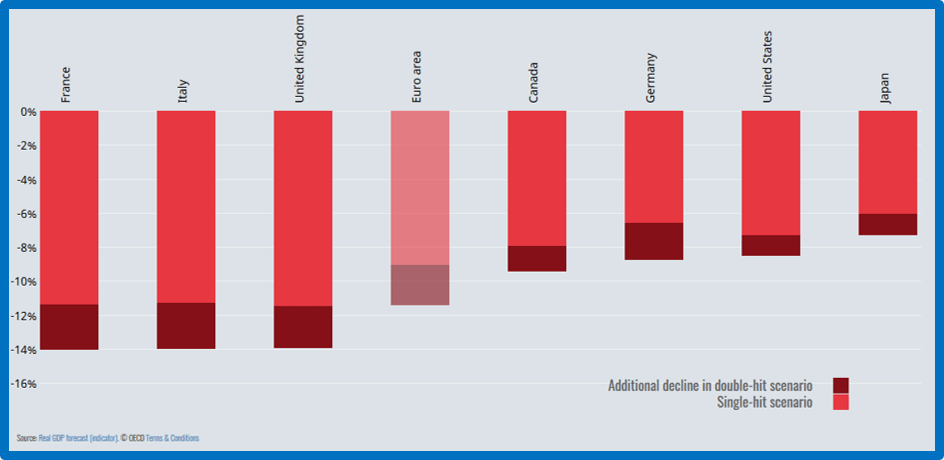
Le prospettive globali sono molto incerte (OECD)
La pandemia COVID-19 è una crisi sanitaria globale senza precedenti nella memoria; ha scatenato la più grave recessione economica degli ultimi 100 anni e sta causando enormi danni alla salute, al lavoro e al benessere delle persone. L’immagine si concentra su due scenari altrettanto probabili: uno in cui una seconda ondata di infezioni, con nuovi blocchi, colpisce prima della fine del 2020 e uno in cui si evita un altro grave focolaio.
http://www.oecd.org/economic-outlook/#Global-outlook
June 10, 2020
The global outlook is highly uncertain (OECD)
The COVID-19 pandemic is a global health crisis without precedent in living memory. It has triggered the most severe economic recession in nearly a century and is causing enormous damage to people’s health, jobs and well-being. The Outlook focuses on two equally probable scenarios – one in which a second wave of infections, with renewed lock-downs, hits before the end of 2020, and one in which another major outbreak is avoided.
http://www.oecd.org/economic-outlook/#Global-outlook
5G coverage world map
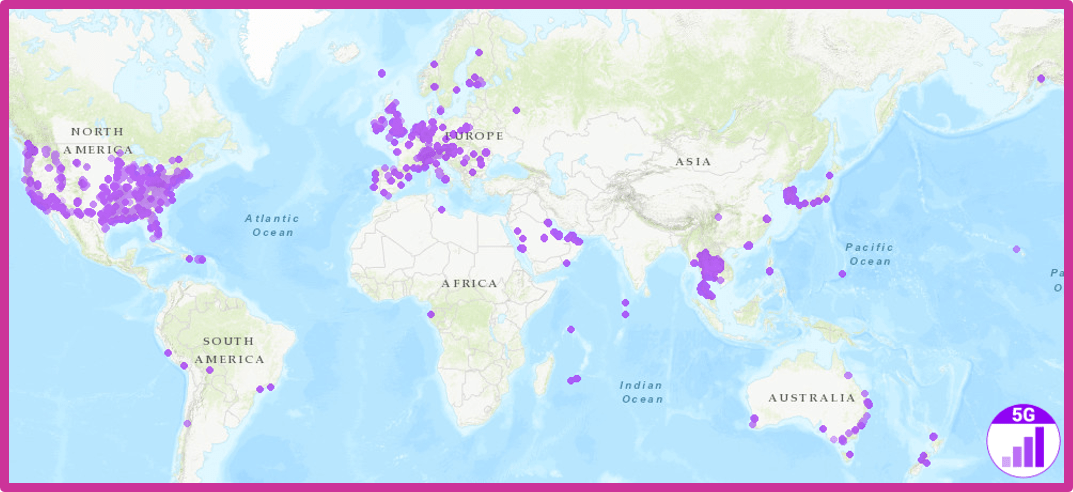
7 giugno 2020.
Mappa mondiale di copertura 5G
I dati vengono raccolti dai test effettuati dagli utenti dell'app nPerf, che consente di seguire il progressivo dispiegamento del 5G nel mondo. Alcune aree in cui è stato rilevato il 5G non sono necessariamente commercialmente aperte. In effetti i test tecnici possono essere eseguiti dagli operatori e dai loro subappaltatori. Al netto di altri indicatori, questa mappa indica, sia pur grossomodo, la localizzazione geografica della tecnologia d’avanguardia, rendendo evidente il divario con i Paesi che non hanno stazioni base per la connessione di telecomunicazione di quinta generazione.
https://www.nperf.com/it/map/5g
June 7, 2020
5G coverage world map
The data is collected from tests performed by users of the nPerf app, which allows you to follow the progressive deployment of 5G around the world. Some areas where 5G was detected are not necessarily commercially open. In fact, technical tests can be performed by operators and their subcontractors. Net of other indicators, this map indicates, albeit roughly, the geographical location of cutting-edge technology, making clear the gap with countries that do not have base stations for the fifth generation telecommunication connection.
https://www.nperf.com/it/map/5g
Carbon dioxide (CO₂), methane (CH₄), and nitrous oxide (N₂O)
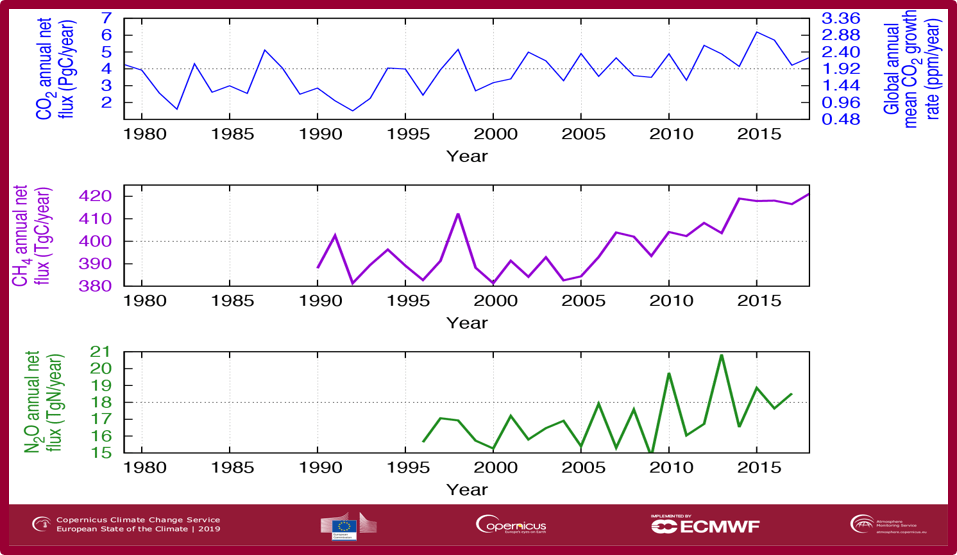
30 aprile 2020.
Flussi annuali netti globali di CO₂, CH₄ e N₂O nell'atmosfera. Le unità sono massa/anno: massa di carbonio per CO₂ (PgC/anno) e CH₄ (TgC/anno) e massa di azoto per N₂O (TgN/anno). Per la CO₂, la massa è stata anche convertita in una concentrazione atmosferica equivalente in parti per milione di molecole di CO₂ rispetto alle molecole di aria secca (ppm/anno). Fonte: Dati sul flusso di gas serra CAMS provenienti da sistemi di inversione atmosferica. Credit: Copernicus Atmosphere Monitoring Service (CAMS) / ECMWF / LSCE / TNO / NILU.
https://www.copernicus.eu/en/news/news/observer-european-state-climate-2019-year-weather-context-climate-change
April 30, 2020.
Net global annual fluxes of CO₂, CH₄ and N₂O into the atmosphere. The units are mass per year: mass of carbon for CO₂ (PgC/year) and CH₄ (TgC/year), and mass of nitrogen for N₂O (TgN/year). For CO₂, the mass has also been converted to an equivalent atmospheric concentration in parts per million molecules of CO₂with respect to molecules of dry air (ppm/year). Data source: CAMS greenhouse gas flux data from atmospheric inversion systems. Credit: Copernicus Atmosphere Monitoring Service (CAMS) /ECMWF /LSCE /TNO /NILU.
https://www.copernicus.eu/en/news/news/observer-european-state-climate-2019-year-weather-context-climate-change
Qualità dell’aria nelle città
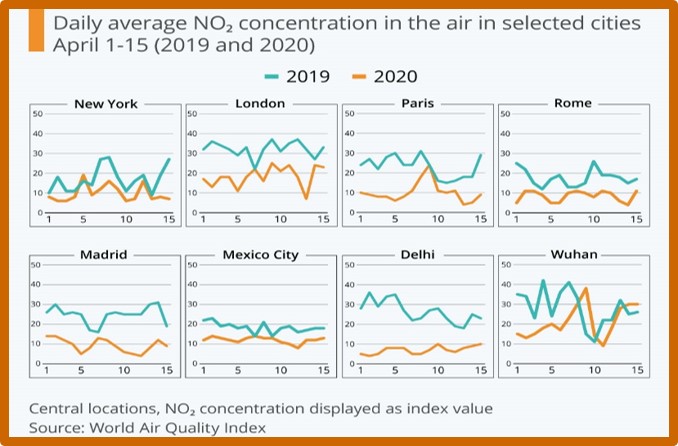
20 aprile 2020. La pandemia di Covid-19 ha bloccato molte attività e conseguentemente la qualità dell’aria è temporaneamente migliorata. Il diossido di azoto (NO₂) è un gas emesso principalmente dai veicoli a motore e dalle fabbriche ed è quindi un buon indicatore dell'attività umana fuori casa.
https://www.statista.com/
April 20, 2020. The Covid-19 pandemic has blocked many activities and consequently the air quality has temporarily improved. Nitrogen dioxide (NO₂) is a gas emitted mainly by motor vehicles and factories and is therefore a good indicator of human activity outside the home.
https://www.statista.com/
Covid-19 impact on flights departures
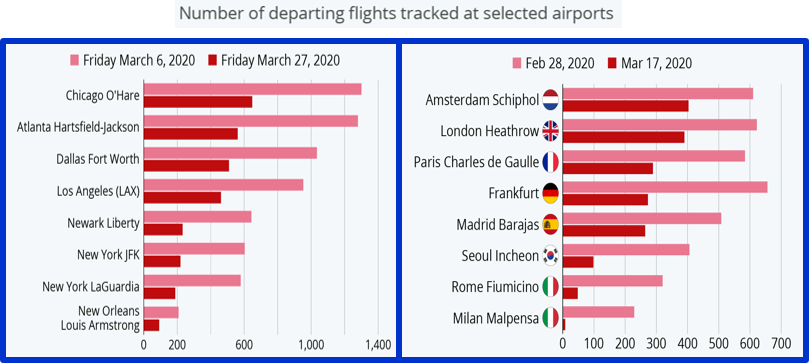
Mentre sempre più Paesi chiudono i propri confini nel tentativo di rallentare la diffusione di COVID-19, gli aeroporti di tutto il mondo si stanno svuotando. La portata dell'interruzione può essere chiaramente vista attraverso i dati statistici compilati dal sito web di monitoraggio dei voli Flightradar24.
https://www.statista.com
As more and more countries close their borders in an attempt to slow the spread of COVID-19, airports all over the world are emptying. The scale of the disruption can be clearly seen through statistical data compiled by flight tracking website Flightradar24.
https://www.statista.com
BeautifulScience

Guarda il video!
Watch the video!
Sostenibilità e salute / Sustainaibility and Health
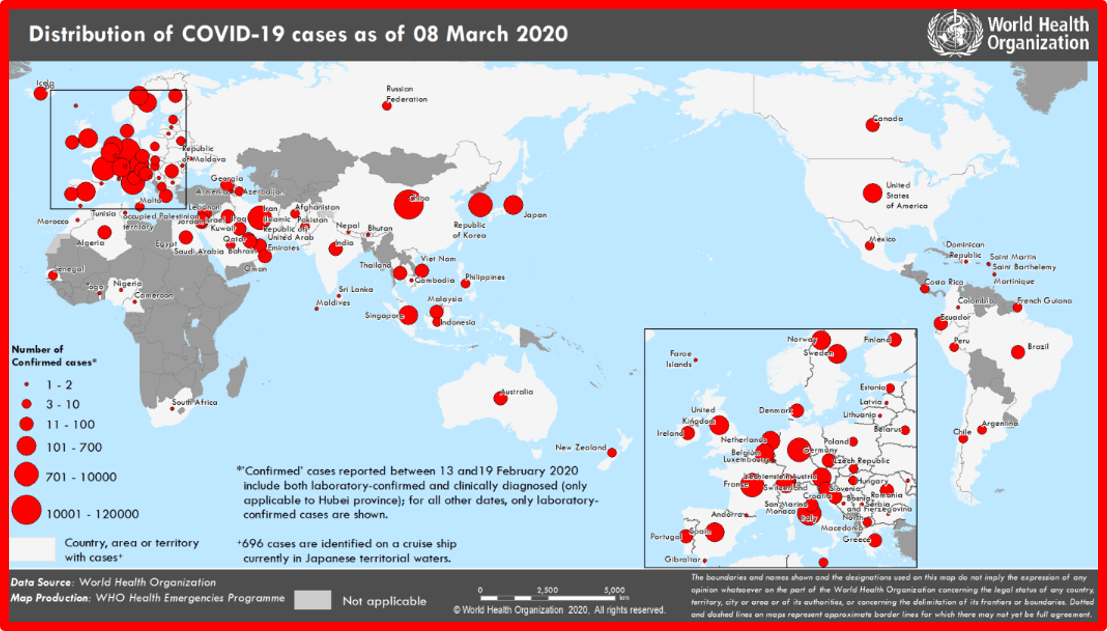
Gli obiettivi strategici dell’0rganizzazione Mondiale della Sanità (OMS)
-Interrompere la trasmissione da uomo a uomo, compresa la riduzione delle infezioni secondarie tra contatti stretti e operatori sanitari, la prevenzione di eventi di amplificazione della trasmissione e l'ulteriore diffusione internazionale *;
-Identificare, isolare e curare tempestivamente i pazienti, inclusa la fornitura di cure ottimizzate per i pazienti infetti;
-Identificare e ridurre la trasmissione dalla fonte animale;
-Affrontare le incognite cruciali relative alla gravità clinica, all'entità della trasmissione e dell'infezione, alle opzioni di trattamento e ad accelerare lo sviluppo di diagnosi, terapia e vaccini;
-Comunicare informazioni critiche sui rischi e sugli eventi a tutte le comunità e contrastare la disinformazione;
-Ridurre al minimo l'impatto sociale ed economico attraverso partenariati multisettoriali.
* Ciò può essere ottenuto attraverso una combinazione di misure di sanità pubblica, quali identificazione rapida, diagnosi e gestione dei casi, identificazione e follow-up dei contatti, prevenzione e controllo delle infezioni nelle strutture sanitarie, attuazione di misure sanitarie per i viaggiatori, aumento della consapevolezza della popolazione e comunicazione del rischio.
https://www.who.int/docs/default-source/coronaviruse/situation-reports/20200308-sitrep-48-covid-19.pdf?sfvrsn=16f7ccef_4
Strategic goals of World Health Organization (WHO)
-Interrupt human-to-human transmission including reducing secondary infections among close contacts and health care workers, preventing transmission amplification events, and preventing further international spread*;
-Identify, isolate andcare for patients early, including providingoptimized care for infected patients;
-Identify and reduce transmission from the animal source;
-Address crucial unknowns regarding clinical severity, extent of transmission and infection, treatment options, and accelerate the development of diagnostics, therapeutics and vaccines;Communicate critical risk and event information to all communities and counter misinformation;
-Minimize social and economic impact through multisectoral partnerships.
*This can be achieved through a combination of public health measures, such as rapid identification, diagnosis and management of the cases, identification and follow up of the contacts, infection prevention and control in healthcare settings, implementation of health measures for travelers, awareness-raising in the populationand risk communication.
https://www.who.int/docs/default-source/coronaviruse/situation-reports/20200308-sitrep-48-covid-19.pdf?sfvrsn=16f7ccef_4
(Mostly) High-Speed Rail Network within Europe 2020
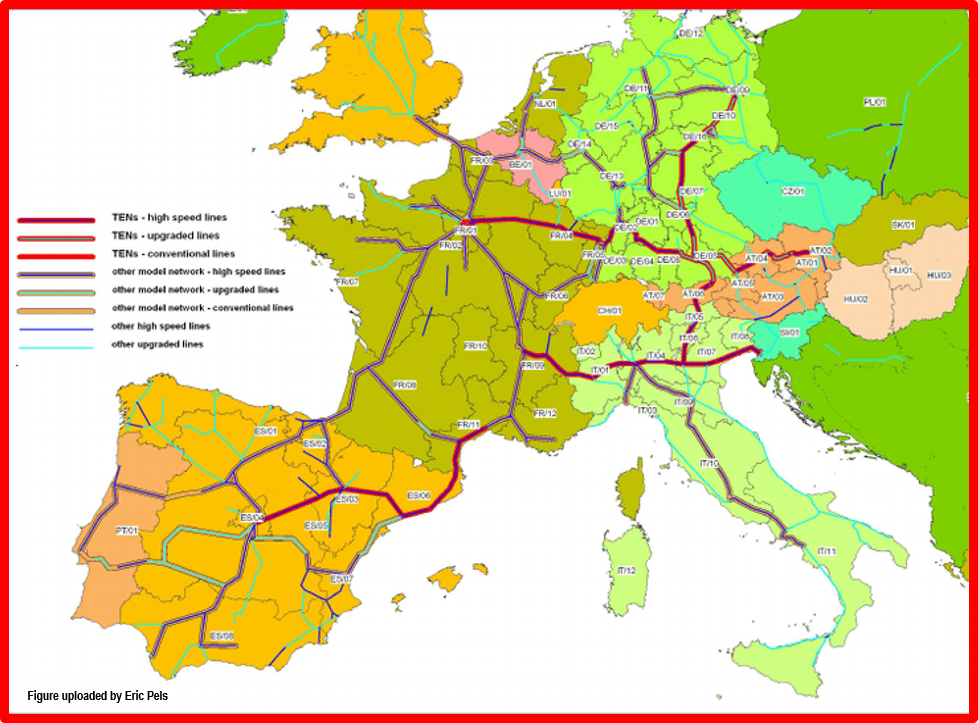
GDP per capita growth, 2020
Crescita del PIL pro capite, 2020
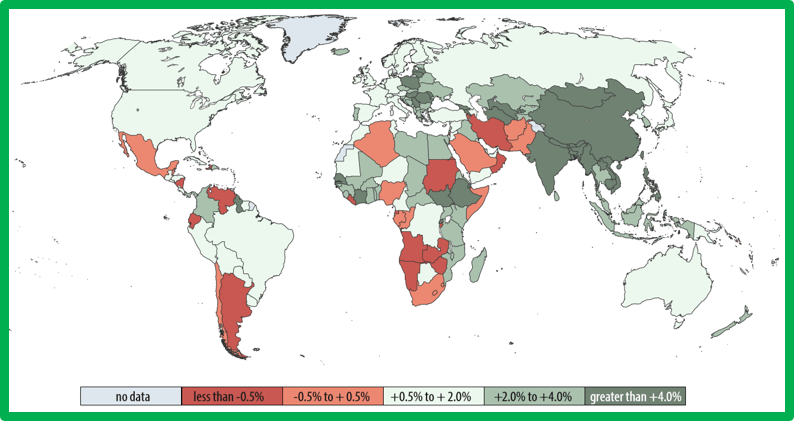
Source/Fonte: World Economic Situation and Prospects 2020
https://www.un.org/development/desa/dpad/wp-content/uploads/sites/45/WESP2020_FullReport.pdf
-
BREXIT: WHAT THE EUROPEAN UNION LOSES
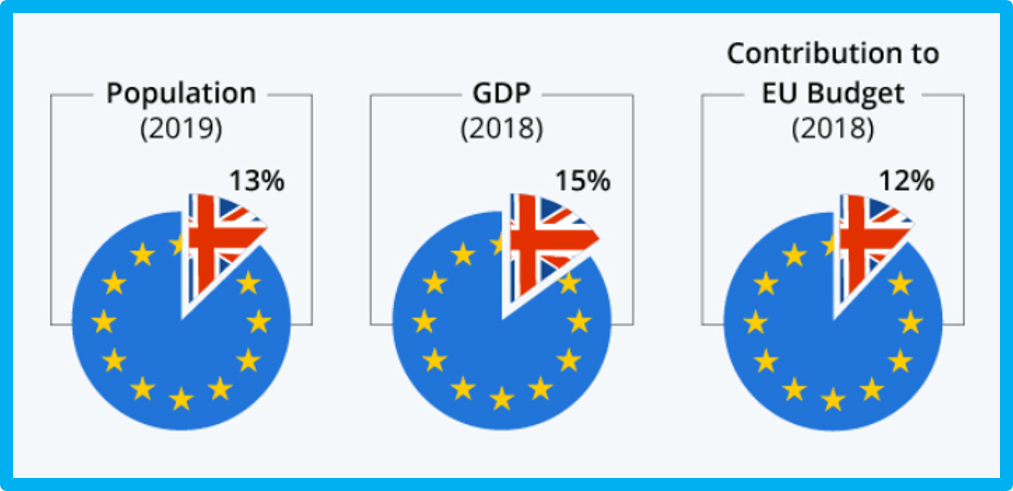
A partire dal 1° febbraio 2020, il Regno Unito non farà più parte dell'Unione Europea.
https://ec.europa.eu/eurostat; https://www.statista.com/
As of 1 February 2020, the United Kingdom will no longer be part of the European Union.
https://ec.europa.eu/eurostat; https://www.statista.com/
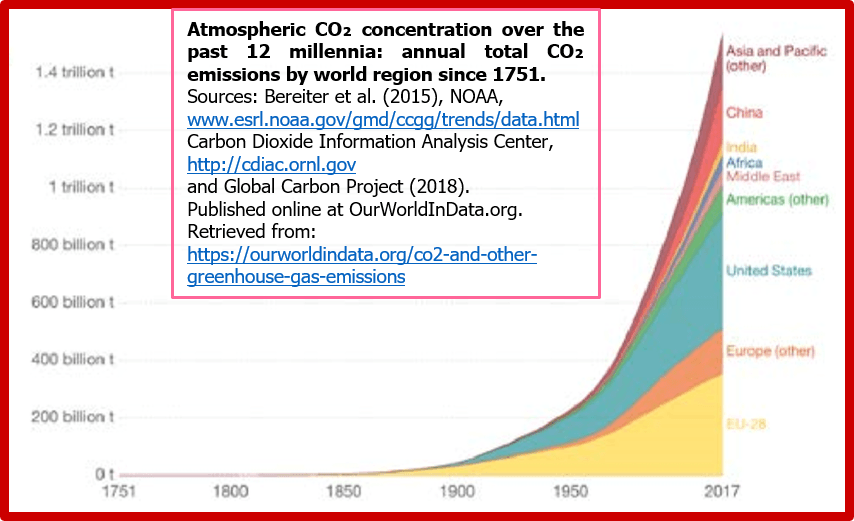
LE REGIONI IN EUROPA
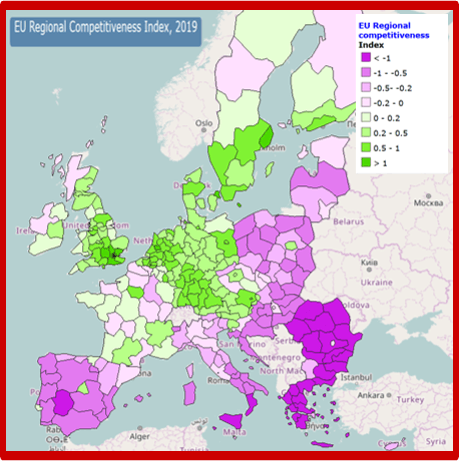
L'INDICE DI COMPETITIVITÀ REGIONALE DELL'UE 2019 della Commissione europea
La competitività regionale è la capacità di una regione di offrire un ambiente attraente e sostenibile alle imprese e ai residenti per vivere e lavorare. L‘indice RCI (pubblicato in ottobre 2019) fornisce un quadro comparabile e sfaccettato del livello di competitività per tutte le regioni dell'Unione Europea. Il livello subnazionale descritto da RCI consente la valutazione delle disuguaglianze dei livelli di competitività tra le regioni e il monitoraggio delle prestazioni nel tempo a livello spaziale disaggregato. L'RCI dovrebbe essere considerato come uno strumento per assistere nella progettazione di politiche migliori e nel monitoraggio della loro efficacia. Essendo un concetto multidimensionale e intrecciato, migliorare la competitività richiede lo sforzo coordinato di molti attori diversi. L‘indice RCI è uno strumento unico, comparabile e trasparente per i decisori nazionali e locali responsabili delle strategie di sviluppo regionale, in particolare nel contesto della politica di coesione.
https://cohesiondata.ec.europa.eu/stories/s/Regional-Competitiveness-Index-2019/363v-4uq6/
https://ec.europa.eu/regional_policy/sources/docgener/work/2019_03_rci2019.pdf
THE EU REGIONAL COMPETITIVENESS INDEX 2019 by European Commission
Regional competitiveness is the ability of a region to offer an attractive and sustainable environment for firms and residents to live and work.The RCI (published October 2019) provides a comparable and multifaceted picture of the level of competitiveness for all EU regions. The sub-national level described by the RCI allows the assessment of inequalities of competitiveness levels across regions and monitoring performance across time at a disaggregated spatial level. The RCI should be considered as an instrument to assist with the design of better policies and monitoring their effectiveness. Being a multidimensional and intertwined concept, improving competitiveness requires the coordinated effort of many different actors. The RCI is a unique, comparable and transparent tool for national and local decision makers responsible for regional development strategies, in particular in the context of cohesion policy.
https://cohesiondata.ec.europa.eu/stories/s/Regional-Competitiveness-Index-2019/363v-4uq6/
https://ec.europa.eu/regional_policy/sources/docgener/work/2019_03_rci2019.pdf
Urbanisation 1990-2050
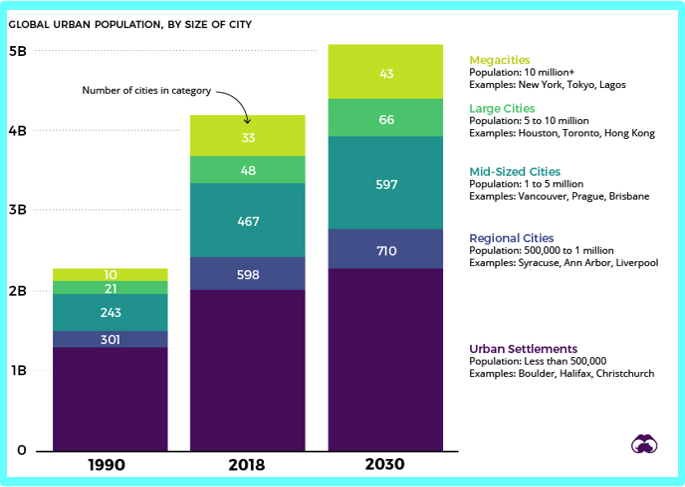
Nel 21° secolo, poche tendenze si sono adattate all'impatto economico, ambientale e sociale della rapida urbanizzazione.
Un flusso costante di migrazioni umane fuori dalla campagna e verso sviluppati centri metropolitani ha scosso la dinamica di potere del mondo. La mappa di oggi (di Cristina Poiata di Z Creative Labs) esamina 70 anni di movimento e crescita della popolazione urbana in oltre 1.800 città in tutto il mondo. Dal 1950, la popolazione urbana mondiale è aumentata di quasi sei volte, da 751 milioni a 4,2 miliardi nel 2018. È interessante notare che sono soprattutto le città di tutta l'Asia e l'Africa che potrebbero presto esercitare un'enorme influenza sul palcoscenico globale. Si prevede che oltre un terzo della prevista crescita urbana tra oggi e il 2050 avverrà in soli tre Paesi: India, Cina e Nigeria. Entro il 2050, si prevede che l'India potrebbe aggiungere 416 milioni di abitanti alle città, Cina 255 milioni e Nigeria 189 milioni. Mentre la rapida urbanizzazione continua a plasmare l'economia globale, trovare modi per fornire le giuste infrastrutture e servizi nelle città sarà un problema cruciale da risolvere per le comunità e le organizzazioni di tutto il mondo.
https://www.visualcapitalist.com/map-global-rise-of-urbanization/
In the 21st century, few trends have matched the economic, environmental, and societal impact of rapid urbanization.
A steady stream of human migration out of the countryside, and into swelling metropolitan centers, has shaken up the world’s power dynamic. Today’s eye-catching map (via Cristina Poiata from Z Creative Labs) looks at 70 years of movement and urban population growth in over 1,800 cities worldwide. Since 1950, the world’s urban population has risen almost six-fold, from 751 million to 4.2 billion in 2018. Interestingly, it’s mainly cities across Asia and Africa that may soon wield enormous influence on the global stage. It’s expected that over a third of the projected urban growth between now and 2050 will occur in just three countries: India, China, and Nigeria. By 2050, it is projected that India could add 416 million urban dwellers, China 255 million, and Nigeria 189 million. As rapid urbanization continues to shape the global economy, finding ways to provide the right infrastructure and services in cities will be a crucial problem to solve for communities and organizations around the world.
https://www.visualcapitalist.com/map-global-rise-of-urbanization/
Climate tipping points - Punti di non ritorno sul clima
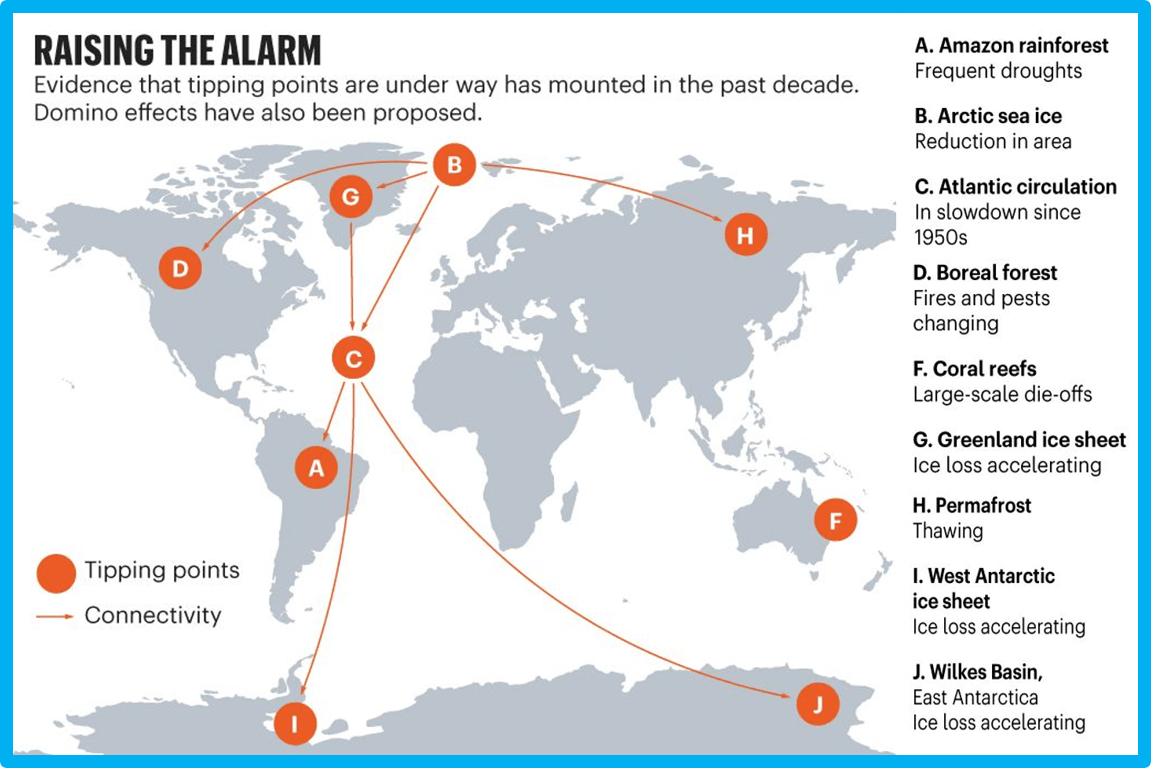
27 novembre 2019
La crescente minaccia di cambiamenti climatici improvvisi e irreversibili deve costringere l'azione politica ed economica sulle emissioni nocive.
https://www.nature.com/articles/d41586-019-03595-0
November 27th, 2019
The growing threat of abrupt and irreversible climate changes must compel political and economic action on emissions.
https://www.nature.com/articles/d41586-019-03595-0
Overshoot Day
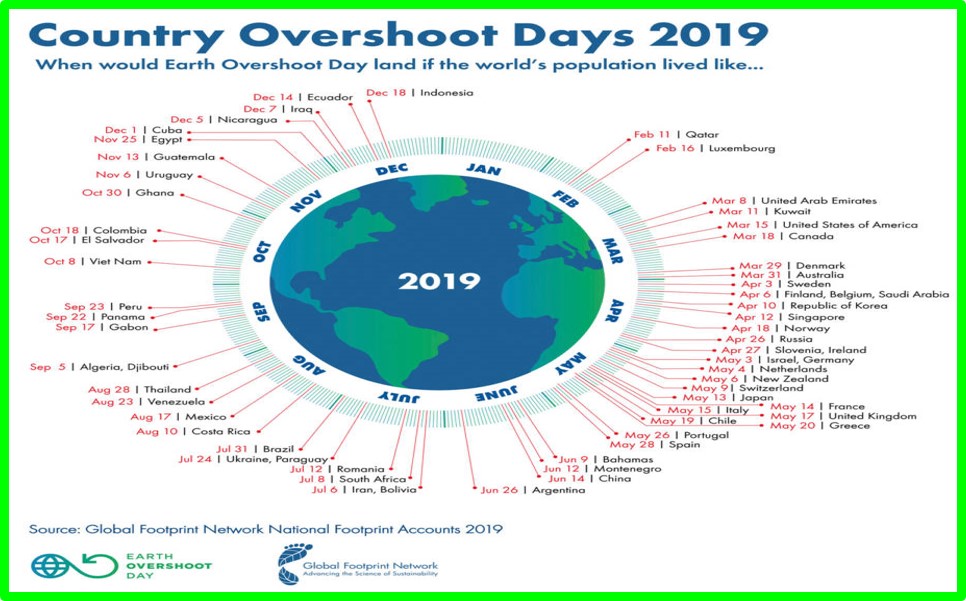
Ottobre 2019
Per l’Europa a 28 membri l’Overshoot Day è arrivato il 10 maggio. Emettiamo più CO2 di quella che gli ecosistemi possono assorbire, strappiamo alle foreste più biomassa di quella che è possibile rigenerare, saccheggiamo i mari a ritmi insostenibili per i pesci ed erodiamo il suolo senza preoccuparci della perdita di biodiversità.
In Italia l’impronta ecologica – l’area necessaria a provvedere a ciò che ciascuno di noi consuma – è di 4,4 ettari globali (gha), mentre la biocapacità del nostro Paese per ogni cittadino è di 0,9 gha. A fine 2019 ognuno di noi sarà quindi in debito con la Terra di 3,5 gha. Storicamente la principale incidenza del debito accumulato col Pianeta riguarda il settore dei trasporti e la produzione di cibo, con un consumo troppo elevato di energia, acqua, terreni e foreste. Tuttavia i Paesi europei non sono tra i peggiori: Cina, Stati Uniti, India, Russia e Brasile hanno la maggior impronta ecologica al mondo. Se l’Europa fosse però un unico Paese, occuperebbe il terzo posto di questa classifica. L’Europa da sola sfrutta infatti il 20% della biocapacità terrestre.
October 2019
For the 28-member Europe, the Overshoot Day arrived on 10 May. We emit more CO2 than the ecosystems can absorb, we tear more biomass from the forests than can be regenerated, we plunder the seas at unsustainable rates for the fish and erode the soil without worrying about the loss of biodiversity.
In Italy the ecological footprint - the area needed to provide what each of us consumes - is 4.4 global hectares (gha), while the biocapacity of our country for every citizen is 0.9 gha. At the end of 2019 each of us will therefore be indebted to the Earth for 3.5 gha. Historically, the main incidence of debt accumulated with the planet concerns the transport sector and food production, with too high consumption of energy, water, land and forests. However, European Countries are not among the worst: China, the United States, India, Russia and Brazil have the largest ecological footprint in the world. However, if Europe were a single country, it would occupy third place in this ranking. Europe alone exploits 20% of the earth's biocapacity.
Robots
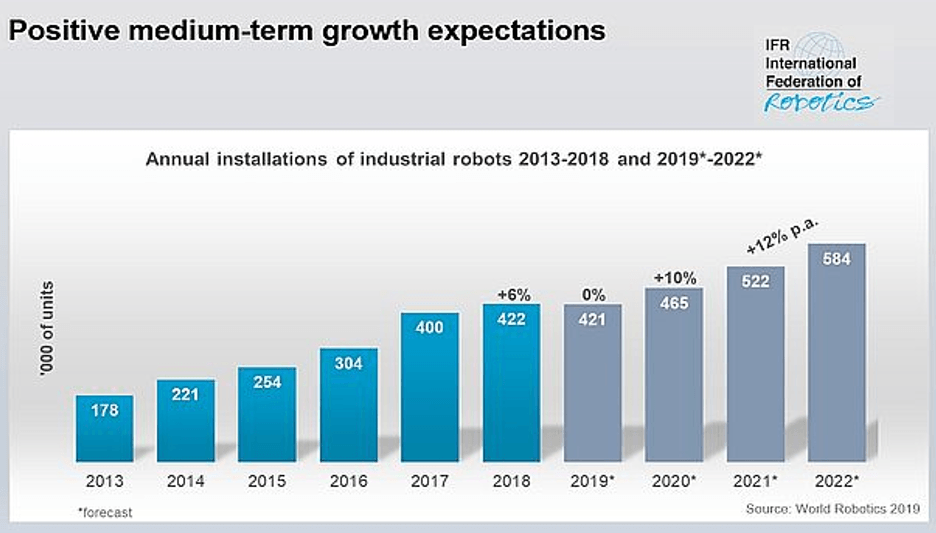
18 settembre 2019
Il nuovo rapporto World Robotics mostra un valore di vendita globale annuo di 16,5 miliardi di dollari nel 2018, un nuovo record. 422.000 unità sono state spedite in tutto il mondo nel 2018, con un aumento del 6 percento rispetto all'anno precedente. Le previsioni IFR nel 2019 saranno inferiori del livello record del 2018, ma si aspetta una crescita media del 12 percento all'anno dal 2020 al 2022.
https://ifr.org/ifr-press-releases
September 18th, 2019
The new World Robotics report shows an annual global sales value of 16.5 billion USD in 2018 – a new record. 422,000 units were shipped globally in 2018 - an increase of 6 percent compared to the previous year. IFR forecasts shipments in 2019 will recede from the record level in 2018, but expects an average growth of 12 percent per year from 2020 to 2022.
https://ifr.org/ifr-press-releases
Increasing vegetation
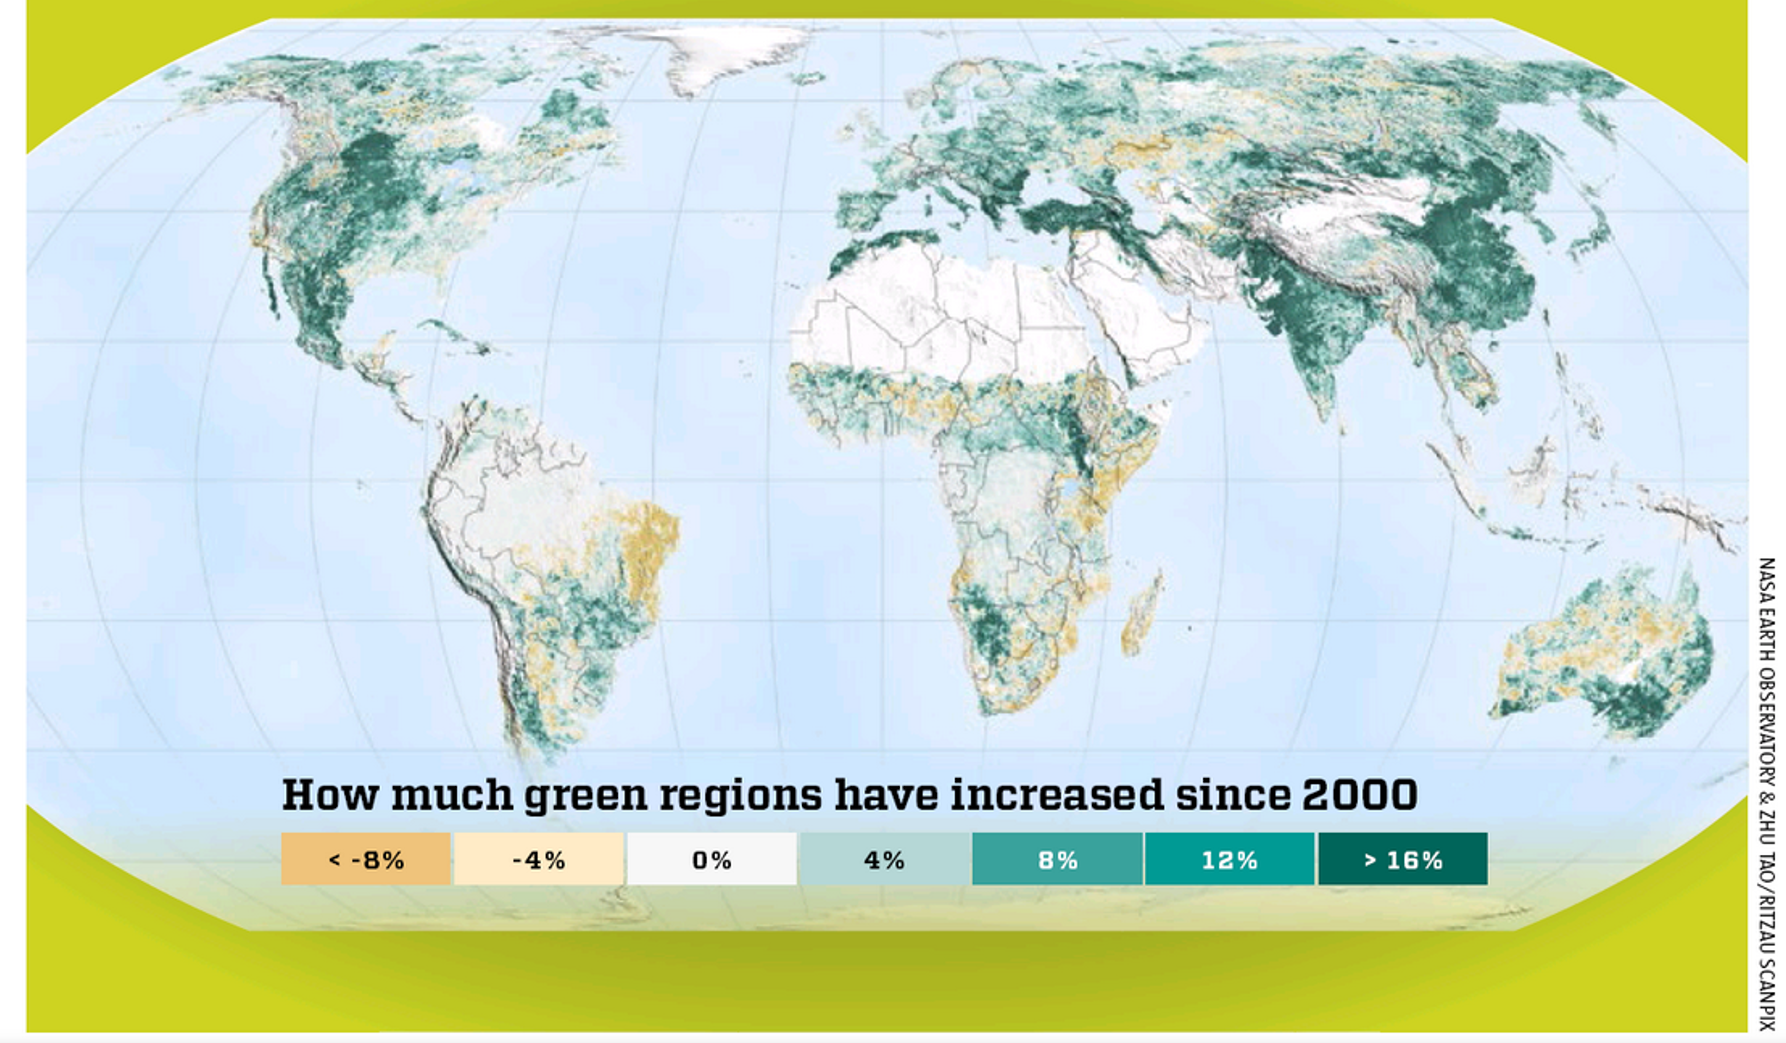
from "Science Illestradted", September 1st, 2019:
The northern hemisphere is in the lead. While the rainforest of South America and Southern Africa are reduced, things are getting ever greener north of the Equator.
OECD GDP growth slows to 0.5% in second quarter of 2019.
La crescita del PIL dell'OCSE rallenta allo 0,5% nel secondo trimestre del 2019.
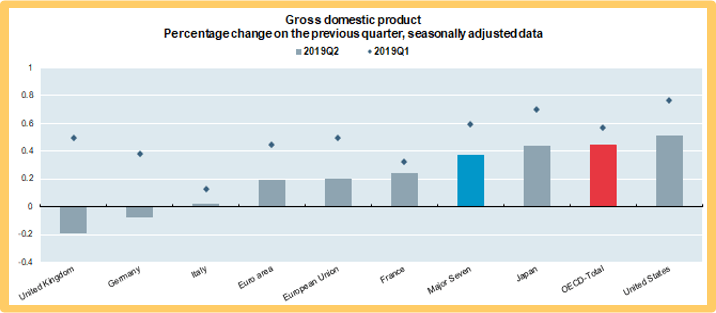
26 agosto 2019. La crescita del prodotto interno lordo reale (PIL) nell'area OCSE è rallentata allo 0,5% nel secondo trimestre del 2019, rispetto allo 0,6% nel trimestre precedente, secondo stime provvisorie. Tra le sette principali economie, la crescita del PIL ha subito un marcato rallentamento nel Regno Unito (a meno 0,2% dallo 0,5% nel trimestre precedente) e in Germania (a meno 0,1% dallo 0,4%). La crescita del PIL ha rallentato, ma più moderatamente, anche negli Stati Uniti e in Giappone (rispettivamente allo 0,5% e allo 0,4%, dallo 0,8% e allo 0,7% nel trimestre precedente) e, marginalmente, in Francia e in Italia (allo 0,2% e 0,0) %, rispettivamente, dallo 0,3% allo 0,1%). La crescita del PIL è rallentata anche nell'Unione europea e nell'area dell'euro (allo 0,2% rispetto allo 0,5% e allo 0,4%, rispettivamente, nel trimestre precedente). La crescita del PIL su base annua per l'area OCSE è rallentata marginalmente all'1,6% rispetto all'1,7% del trimestre precedente. Tra le sette principali economie, gli Stati Uniti hanno registrato la crescita annuale più elevata (2,3%), mentre l'Italia ha registrato la crescita annuale più bassa (0,0%).
http://www.oecd.org/sdd/na/gdp-growth-second-quarter-2019-oecd.htm
August 26th, 2019. Growth of real gross domestic product (GDP) in the OECD area slowed to 0.5% in the second quarter of 2019, compared with 0.6% in the previous quarter, according to provisional estimates. Among the Major Seven economies, GDP growth slowed markedly in the United Kingdom (to minus 0.2% from 0.5% in the previous quarter) and in Germany (to minus 0.1% from 0.4%). GDP growth also decelerated, but more moderately, in the United States and Japan (to 0.5% and 0.4%, respectively, from 0.8% and 0.7% in the previous quarter) and, marginally, in France and Italy (to 0.2% and 0.0%, respectively, from 0.3% and 0.1%). GDP growth also slowed in the European Union and the euro area (to 0.2% compared with 0.5% and 0.4%, respectively, in the previous quarter). Year-on-year GDP growth for the OECD area slowed marginally to 1.6% compared with 1.7% in the previous quarter. Among the Major Seven economies, the United States recorded the highest annual growth (2.3%), while Italy recorded the lowest annual growth (0.0%).
http://www.oecd.org/sdd/na/gdp-growth-second-quarter-2019-oecd.htm
STANDARD EUROBAROMETER 2019 - Public opinion in the European Union
(QA6a.10) “I would like ask you about how much trust you have in the European Union” (%)
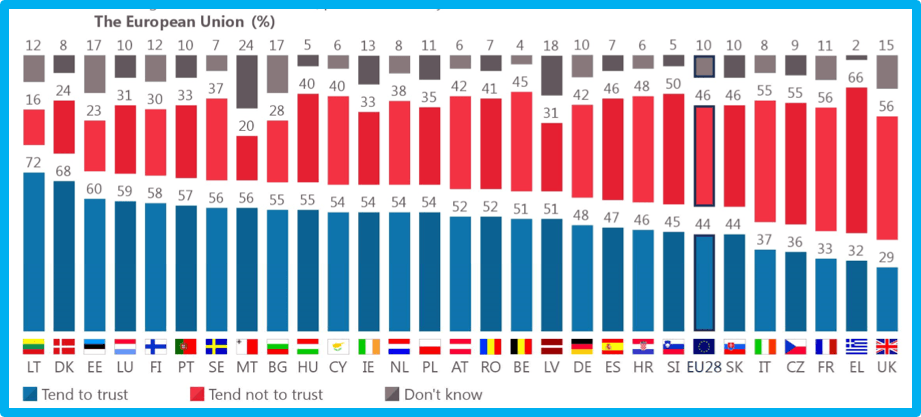
5 agosto 2019. L’indagine Eurobarometro si è svolta dopo le elezioni europee, tra il 7 giugno e il 1° luglio 2019 in tutti i 28 Paesi dell'UE e in 5 Paesi candidati. Sono state realizzate 27.464 interviste.
http://ec.europa.eu/commfrontoffice/publicopinion/index.cfm/survey/getsurveydetail/instruments/standard/surveyky/2253
August 5th, 2019. The Eurobarometer survey took place after the European elections, between 7 June and 1 July 2019 in all 28 EU countries and 5 candidate countries. 27,464 interviews were conducted.
http://ec.europa.eu/commfrontoffice/publicopinion/index.cfm/survey/getsurveydetail/instruments/standard/surveyky/2253
THERMOMETER
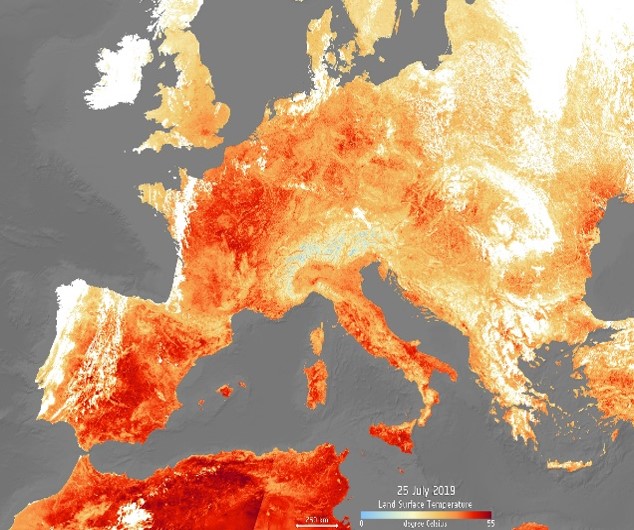
25 luglio 2019. Un'ondata di caldo estremo ha colpito l'Europa, dopo il caldo periodo di giugno. Domani si prevede che le alte temperature raggiungeranno il picco, raggiungendo i 39-40 ° C, con Paesi Bassi, Belgio e Germania che registrano le loro temperature più alte di sempre. Parigi raggiungerà i 41 ° C, battendo il suo record precedente nel 1947. La mappa è stata generata utilizzando il radiometro della temperatura della superficie del mare e della terra di Copernicus Sentinel-3. Mentre le previsioni meteorologiche utilizzano la temperatura dell'aria prevista, il satellite misura la quantità reale di energia che si irradia dalla Terra, quindi questa mappa rappresenta meglio la temperatura reale della superficie terrestre.
July 25th, 2019. An extreme heatwave has hit Europe, following June's hot spell. High temperatures are expected to peak tomorrow, reaching as high as 39—40°C, with Netherlands, Belgium and Germany recording their highest ever temperatures. Paris will reach a sweltering 41°C, breaking its previous record in 1947. The map has been generated using the Copernicus Sentinel-3’s Sea and Land Surface Temperature Radiometer. Whereas weather forecasts use predicted air temperatures, the satellite measures the real amount of energy radiating from Earth – therefore this map better represents the real temperature of the land surface.
Nitrogen dioxide over Europe
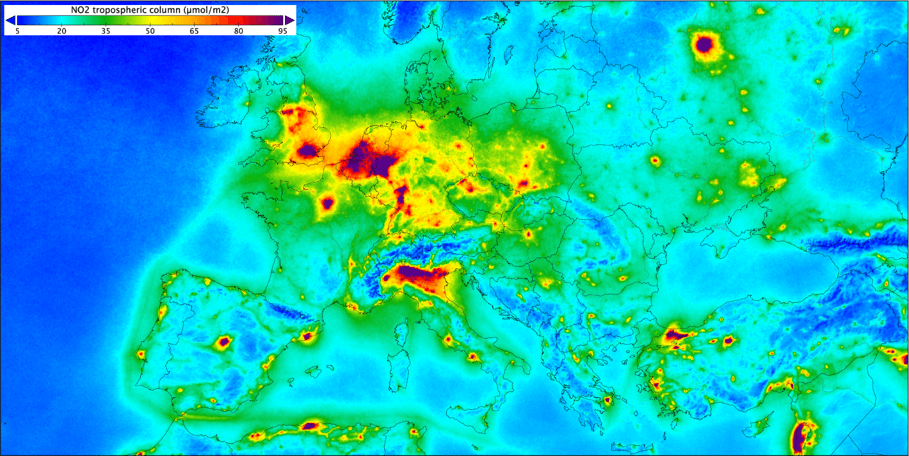
Sulla base delle misurazioni raccolte dalla missione Copernicus Sentinel-5P tra aprile 2018 e marzo 2019, l'immagine mostra il biossido di azoto in Europa. Il biossido di azoto inquina l'aria principalmente a causa del traffico e della combustione di combustibili fossili nei processi industriali. Ha un impatto significativo sulla salute umana, contribuendo in modo particolare ai problemi respiratori.
https://www.copernicus.eu/en/media/images/nitrogen-dioxide-over-europe-0
Based on measurements gathered by the Copernicus Sentinel-5P mission between April 2018 and March 2019, the image shows nitrogen dioxide over Europe. Nitrogen dioxide pollutes the air mainly as a result of traffic and the combustion of fossil fuel in industrial processes. It has a significant impact on human health, contributing particularly to respiratory problems.
https://www.copernicus.eu/en/media/images/nitrogen-dioxide-over-europe-0
Real GDP growth (Annual percent change, 2019).
Crescita del PIL reale (variazione percentuale annuale, 2019)
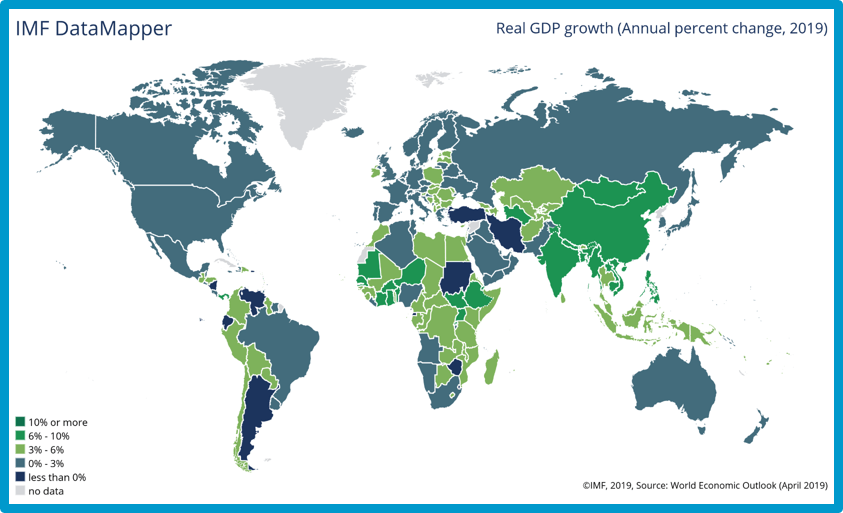
Crescita del PIL reale (variazione percentuale annuale, 2019). Il Prodotto Interno Lordo è la singola misura più comunemente utilizzata per l'attività economica complessiva di un Paese. Rappresenta il valore totale a prezzi costanti di beni e servizi finali prodotti all'interno di un Paese durante un periodo di tempo specificato, ad esempio un anno. Source: World Economic Outlook (April 2019)
https://www.imf.org/external/datamapper/NGDP_RPCH@WEO/OEMDC/ADVEC/WEOWORLD
Real GDP growth (Annual percent change, 2019). Gross Domestic Product is the most commonly used single measure of a Country's overall economic activity. It represents the total value at constant prices of final goods and services produced within a Country during a specified time period, such as one year. Fonte: World Economic Outlook (April 2019)
https://www.imf.org/external/datamapper/NGDP_RPCH@WEO/OEMDC/ADVEC/WEOWORLD
General government gross debt. Percent of GDP.
Debito lordo della pubblica amministrazione. Percentuale del PIL.
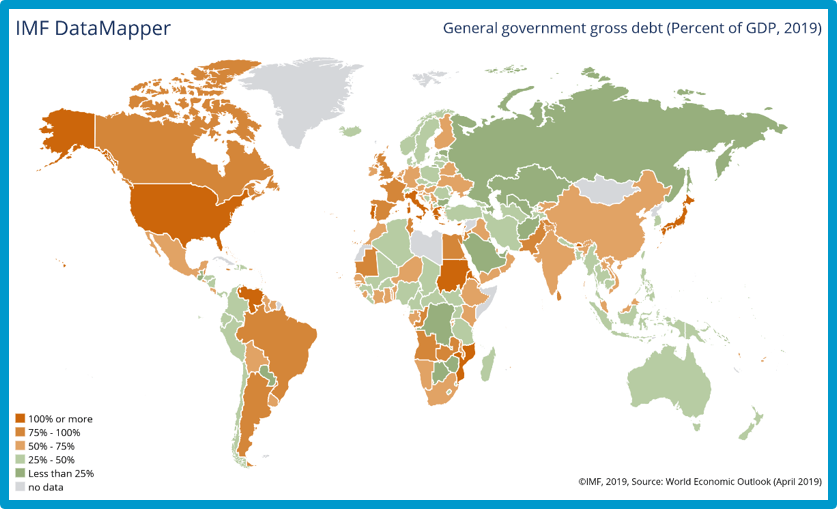
Debito lordo della pubblica amministrazione. Percentuale del PIL
Il debito lordo consiste in tutte le passività che richiedono il pagamento o il pagamento di interessi e / o capitale dal debitore al creditore in una data o date future. Ciò include le passività del debito sotto forma di DSP (diritti speciali di prelievo), valute e depositi, titoli di debito, prestiti, assicurazioni, pensioni e schemi di garanzia standardizzati e altri debiti. Pertanto, tutte le passività del sistema GFSM 2001 sono di debito, ad eccezione delle azioni azionarie e dei fondi di investimento e dei derivati finanziari e delle stock option dei dipendenti. Il debito può essere valutato al valore corrente di mercato, nominale o nominale (Government Finance Statistics Manual - GFSM 2001, paragrafo 7.110). Fonte: World Economic Outlook (aprile 2019)
https://www.imf.org/external/datamapper/GGXWDG_NGDP@WEO/OEMDC/ADVEC/WEOWORLD
General government gross debt. Percent of GDP
Gross debt consists of all liabilities that require payment or payments of interest and/or principal by the debtor to the creditor at a date or dates in the future. This includes debt liabilities in the form of SDRs (special drawing rights), currency and deposits, debt securities, loans, insurance, pensions and standardized guarantee schemes, and other accounts payable. Thus, all liabilities in the GFSM 2001 system are debt, except for equity and investment fund shares and financial derivatives and employee stock options. Debt can be valued at current market, nominal, or face values (Government Finance Statistics Manual - GFSM 2001, paragraph 7.110). Source: World Economic Outlook (April 2019)
https://www.imf.org/external/datamapper/GGXWDG_NGDP@WEO/OEMDC/ADVEC/WEOWORLD
2019 GLOBAL PEACE INDEX
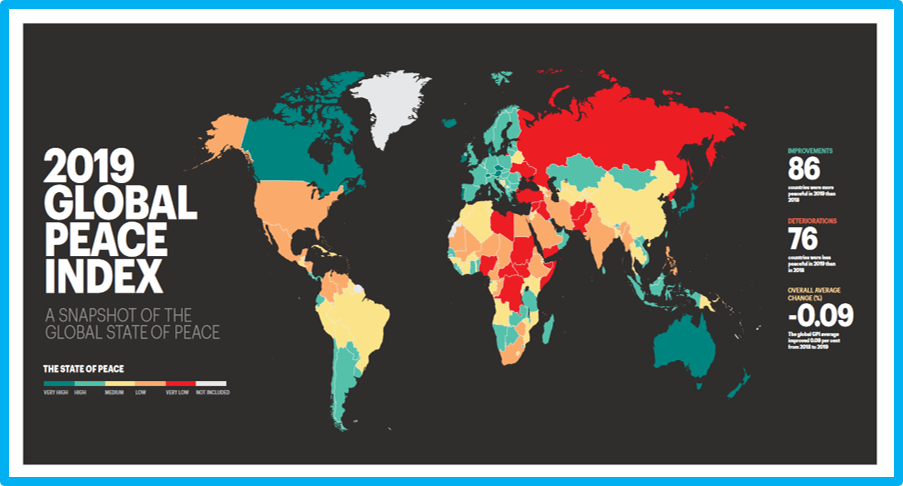
GPI 2019 Wall Chart - Giugno 2019
La mappa indica con i colori (dal blu al rosso) l'indice attribuito agli Stati. L'illustrazione è tratta dal documento Global Peace Index 2019: Measuring Peace in a Complex World, recensito nella sezione Reports del sito della Fondazione Salvetti.
GPI 2019 Wall Chart - June 2019
The map indicates with the colors (from blue to red) the index assigned to the States. The illustration is taken from the Global Peace Index 2019: Measuring Peace in a Complex World document, reviewed in the Reports section of the Salvetti Foundation website.
UNITED NATIONS - Agenda 2030
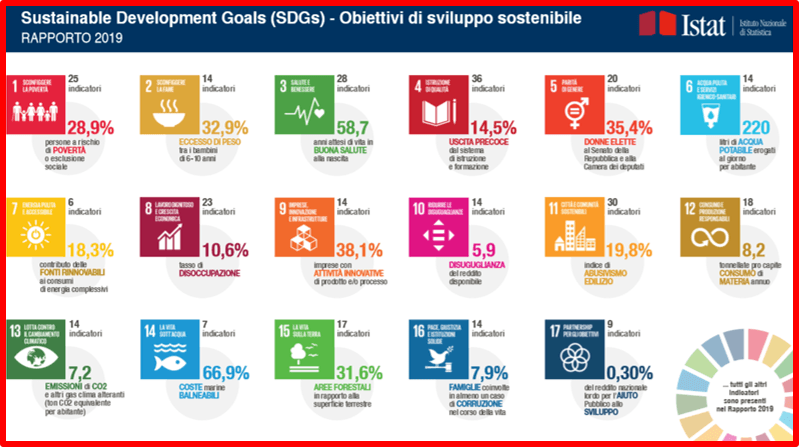
Agenda 2030. Il 25 settembre 2015, le Nazioni Unite hanno approvato l’Agenda Globale per lo sviluppo sostenibile e i relativi 17 Obiettivi di sviluppo sostenibile (Sustainable Development Goals – SDGs nell’acronimo inglese), da raggiungere entro il 2030. Ecco l’elenco e il livello di raggiungimento in Italia secondo il Rapporto Istat 2019.
Agenda 2030. On 25 September 2015, the United Nations approved the Global Agenda for Sustainable Development and its 17 Sustainable Development Goals (SDGs in the English acronym), to be reached by 2030. Here is the list and the level of achievement in Italy according to the Istat Report 2019.
SALVETTI FOUNDATION - EFNMS AWARDS
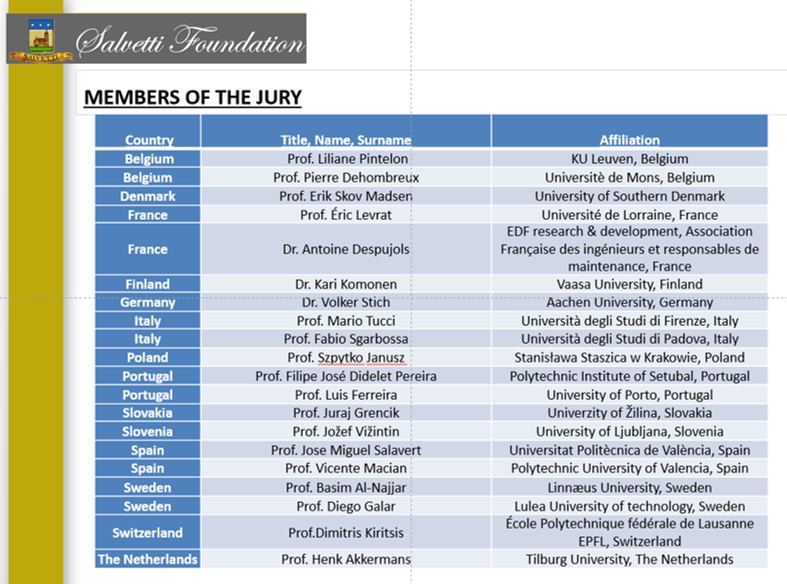
La Fondazione Salvetti, in accordo con la EFNMS (European Federation of National Maintenance Societies) ha istituito una serie di Premi per il settore della Manutenzione industriale.
1) EFNMS Excellence Award for M.Sc. Thesis & Ph.D. Thesis in Maintenance (qui sopra l’elenco dei membri della Giuria, coordinata dal Prof. Marco Macchi del Politecnico di Milano)
2) European Maintenance Manager Award (EMMA)
3) Best 5 Papers Award – EuroMaintenance Congress (Asset management, Health Safety and Environment, Maintenance Management, Reliability Fundamentals, Smart Maintenance)
Info: www.salvettifoundation.com/awards/
The Salvetti Foundation, in agreement with the EFNMS (European Federation of National Maintenance Societies) has established a series of Awards for the Industrial Maintenance sector.
1)EFNMS Excellence Award for M.Sc. Thesis & Ph.D. Thesis in Maintenance (above, the list of members of the Jury, coordinated by Prof. Marco Macchi of the Politecnico di Milano).
2) European Maintenance Manager Award (EMMA)
3) Best 5 Papers Award - EuroMaintenance Congress (Asset management, Health Safety and Environment, Maintenance Management, Reliability Fundamentals, Smart Maintenance)
Info: www.salvettifoundation.com/awards/
31° EUCYS – European Union Contest for Young Scientists Milano 2019
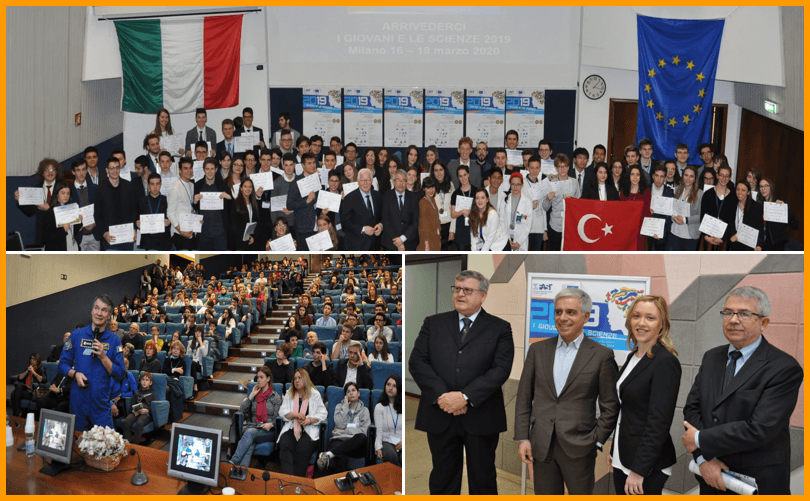
Su incarico della Direzione generale Ricerca della Commissione Europea, la manifestazione I giovani e le scienze è realizzata fin dal 1989 dalla FAST (Federazione delle Associazioni Scientifiche e Tecniche), scelta come National Organiser con il compito di selezionare i migliori talenti italiani da inviare alla finale europea del Concorso. La FAST valorizza ulteriormente l’importante esperienza scegliendo o accreditando anche i ragazzi più meritevoli per rappresentare l’Italia nei più prestigiosi eventi internazionali degli studenti eccellenti; inoltre, in collaborazione con la Fondazione Salvetti, Sponsor dell’evento, ha invitato l’astronauta Paolo Nespoli al Forum Giovani Scienziati, di cui fanno parte tutti i vincitori delle varie edizioni del Concorso.
Info: http://www.fast.mi.it/gs2019/programma2019.pdf
On behalf of the Directorate-General for Research of the European Commission, the Young Scientist event has been organized since 1989 by FAST (Federation of Scientific and Technical Associations), chosen as National Organizer with the task of selecting the best Italian talents to send to the European final of the Contest. The FAST further enhances the important experience by choosing or accrediting even the most deserving students to represent Italy in the most prestigious international events of excellent students; in addition, in collaboration with the Salvetti Foundation, event sponsor, he invited astronaut Paolo Nespoli to the Young Scientists Forum, which includes all the winners of the various editions of the Contest.
Info: http://www.fast.mi.it/gs2019/programma2019.pdf